35 Most Powerful Candlestick Patterns (Free) Download
Candlestick patterns are one of the most essential tools in a trader’s toolkit. They provide insights into market sentiment and can help traders predict potential price movements. Whether you’re trading stocks, Forex, or cryptocurrencies, understanding these patterns can give you a significant edge in making informed decisions. Here’s a breakdown of the 35 most powerful candlestick patterns you should master:
What Are the Most Powerful Bullish Candlestick Patterns?
Bullish candlestick patterns are key indicators that signal potential upward reversals in price action, giving traders an opportunity to enter or hold long positions.
Learn more about smart money concepts
What is Hammer Candlestick?
The Hammer is a single candlestick pattern with a small body near the top and a long lower wick (tail). It typically appears after a downtrend.
A Hammer suggests that the market is trying to push prices lower, but buyers step in, driving the price back up near the open. This rejection of lower prices signals that the downtrend might be losing strength and a reversal to the upside could occur.
What are Bullish Engulfing Patterns?
A Bullish Engulfing is a two-candlestick pattern where a small bearish candle is followed by a larger bullish candle that completely engulfs the prior candle’s body.
This pattern shows a strong shift in momentum from sellers to buyers. The second candle’s larger size suggests a surge in buying pressure, which can lead to a potential trend reversal to the upside.
What is Piercing Line Candlestick?
The Piercing Line is a two-candlestick pattern where the first candle is bearish, and the second is bullish, closing above the midpoint of the first.
This pattern occurs during a downtrend, indicating that the bears were initially in control, but strong buying pressure caused the second candle to close higher than expected. This reversal signals that a bullish move may follow.
What are Morning Star?
The Morning Star is a three-candlestick pattern: the first candle is bearish, the second has a small body (could be bullish or bearish), and the third is a strong bullish candle.
This pattern signals that the downtrend is losing momentum. The small second candle reflects market indecision, and the third bullish candle confirms that buyers are taking over, indicating a potential reversal.
What is Three White Soldiers Candlestick Pattern?
The Three White Soldiers pattern consists of three consecutive bullish candles, each closing near or at their highs, with little to no wicks.This pattern shows strong, sustained buying pressure over three periods, signaling a powerful reversal from a downtrend or the continuation of an uptrend. It’s often seen as a sign of bullish strength.
What is Inverted Hammer Pattern?
The Inverted Hammer has a small body at the bottom with a long upper wick, typically occurring after a downtrend.
The long upper wick shows that buyers tried to push the price higher, but the bears pulled it back. Despite the bears’ effort, the price closed near its open, suggesting that the downtrend may be coming to an end, with bulls potentially gaining control.
What is Dragonfly Doji Pattern?
A Dragonfly Doji forms when the open, close, and high prices are at or near the same level, with a long lower shadow.
The long lower wick indicates that sellers drove prices lower during the session, but buyers stepped in and pushed prices back to the open. This rejection of lower prices is a bullish signal, indicating that the market may reverse upwards.
What is Bullish Harami
The Bullish Harami is a two-candlestick pattern where a small bullish candle forms within the body of the previous large bearish candle.
The small bullish candle shows that selling pressure is weakening, and indecision is forming. This pattern often signals that the downtrend may be ending, and a potential bullish reversal could be on the horizon.
What is Rising Three Methods Candlestick Pattern?
The Rising Three Methods pattern consists of a long bullish candle followed by three small bearish candles, then another strong bullish candle.
The three small bearish candles indicate a temporary pullback, but the final strong bullish candle suggests that the overall uptrend will continue. It’s a bullish continuation pattern, indicating that buyers remain in control.
Three Inside Up Candlestick?
This three-candlestick pattern starts with a large bearish candle, followed by a smaller bullish candle inside the first one, and then a bullish candle that closes above the first candle’s open.
The pattern signals a weakening bearish trend, as buyers step in and close the third candle above the open of the first. This shift from bearish to bullish momentum suggests that a reversal may follow.
What Are The Most Powerful Bearish Candlestick Patterns?
Bearish candlestick patterns indicate that the market may reverse to the downside, signaling an opportunity for traders to either sell or enter short positions. These patterns appear after an uptrend and often suggest that selling pressure is increasing. Let’s explore each of the most powerful bearish candlestick patterns in detail.
What Is Meant by a Shooting Star Pattern?
The Shooting Star is a single candlestick pattern with a small body near the bottom and a long upper shadow. It typically forms after an uptrend. The long upper shadow shows that the price was pushed higher during the session, but sellers stepped in, driving the price back down near the open. This results in a small body at the lower end of the candle and a long upper wick.
The Shooting Star signals that the buyers are losing control, and the sellers are gaining strength. It indicates that the upward movement might be over and a bearish reversal could follow.
What Is Bearish Engulfing Pattern?
A Bearish Engulfing is a two-candlestick pattern where a small bullish candle is followed by a larger bearish candle that completely engulfs the previous candle’s body. The second candle opens higher than the first and closes significantly lower, “engulfing” the entire first candle’s range.
This pattern suggests that sellers have taken control after an uptrend, overpowering buyers. The large bearish candle reflects strong selling pressure, indicating that a downtrend may begin.
What Is an Evening Star Pattern?
The Evening Star is a three-candlestick pattern that consists of a large bullish candle, followed by a small indecisive candle (could be bullish or bearish), and then a large bearish candle. It usually appears after an uptrend.
The Evening Star signals a weakening of the uptrend. The indecisive middle candle shows market hesitation, and the final bearish candle confirms that sellers are taking over, often leading to a downward reversal.
What Is Dark Cloud Cover Pattern?
The Dark Cloud Cover pattern is a two-candlestick formation where the first candle is bullish, and the second bearish candle opens above the previous high but closes below the midpoint of the first candle. It appears during an uptrend.
This pattern suggests that sellers are entering the market after a strong upward move. The bearish candle closing below the midpoint shows that selling pressure is increasing, signaling a possible reversal to the downside.
What Is Three Black Crows Pattern?
The Three Black Crows pattern consists of three consecutive bearish candlesticks with little to no wicks. Each candle opens within the previous candle’s body and closes lower.
This pattern indicates strong, continuous selling pressure over three sessions. It shows that the market is firmly controlled by sellers and that a downtrend may continue or accelerate.
What Is Meant by a Gravestone Doji Pattern?
A Gravestone Doji has a long upper shadow and no lower shadow, with the open and close occurring at or near the low of the session. It forms after an uptrend.
The Gravestone Doji signals that buyers tried to push prices higher, but sellers overpowered them, bringing the price back down to the open. This pattern often signals the end of the uptrend and a potential bearish reversal.
What Is the meaning of Bearish Harami Pattern?
The Bearish Harami is a two-candlestick pattern where the second candle is small and bearish, forming within the body of the first larger bullish candle. It appears at the top of an uptrend.
This pattern indicates that the bullish momentum is weakening. The small bearish candle suggests growing selling pressure, hinting at a possible reversal if confirmed by future bearish action.
What Is the meaning of Falling Three Methods Pattern?
The Falling Three Methods pattern consists of a large bearish candle, followed by three small bullish candles, and then another large bearish candle. It usually forms during a downtrend.
The small bullish candles represent a temporary pullback or consolidation, but the final bearish candle signals that the downtrend will likely continue, with sellers remaining in control.
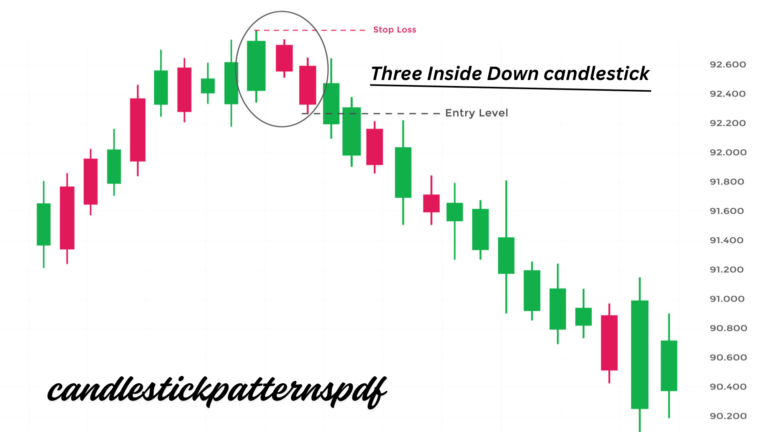
What Is Three Inside Down Pattern?
The Three Inside Down is a three-candle pattern where the first candle is bullish, the second is a smaller bearish candle inside the first one, and the third is a bearish candle that closes below the first candle’s open.
This pattern suggests that the uptrend is losing momentum. The final bearish candle confirms that sellers are taking over, signaling a potential downtrend or reversal.
What Is Meant by a Hanging Man Pattern?
A Hanging Man forms at the top of an uptrend and has a small body with a long lower wick, similar to a Hammer. However, it signals a potential reversal in an uptrend.
The long lower wick shows that sellers were able to push prices lower during the session, but buyers recovered. However, this pattern warns that the uptrend might be losing strength, and further bearish action may follow if confirmed by the next candle.
Bearish candlestick patterns reflect a shift in market sentiment from bullish (optimistic) to bearish (pessimistic). These patterns typically form after an uptrend and signal that the buying momentum is weakening, and selling pressure is increasing. When traders spot these patterns, they anticipate that the market is about to reverse or that a downtrend is gaining strength. Bearish patterns reveal that sellers are gaining control over the market, and traders can prepare to exit long positions or take short positions to benefit from the expected downward movement.