
Dark Cloud Cover Candlestick Pattern – What Is And How To Trade
The financial markets are a battlefield where traders constantly look for strategic advantages. Among the many
weapons in a trader’s arsenal, candlestick patterns stand out as powerful tools for price action analysis.
Today, we’re focusing on one of the most reliable bearish reversal signals in technical analysis: the Dark Cloud Cover candlestick pattern.
What Is The Dark Cloud Cover Candlestick Pattern
The Dark Cloud Cover is a two-candle bearish reversal pattern that forms at the end of an uptrend, signaling a potential shift in market sentiment from bullish to bearish. As the name suggests, this pattern casts a shadow over previous bullish momentum, warning traders of possible stormy market conditions ahead.
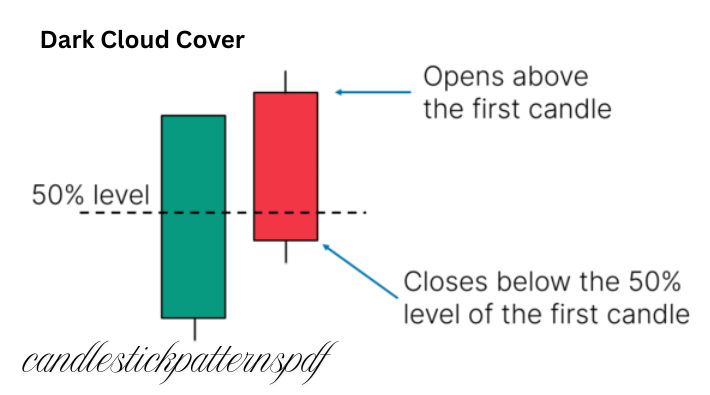
The pattern consists of:
- A strong bullish (green/white) candle that continues the existing uptrend
- A bearish (red/black) candle that opens above the high of the previous candle but closes below the midpoint of the first candle’s body
This formation indicates that buyers initially pushed the price higher (shown by the gap up open), but sellers eventually took control, pushing the price down significantly and “covering” much of the previous day’s gains. This shift in power from buyers to sellers is what makes the Dark Cloud Cover a potential turning point in market direction.
How To Identify The Dark Cloud Cover Candlestick Pattern
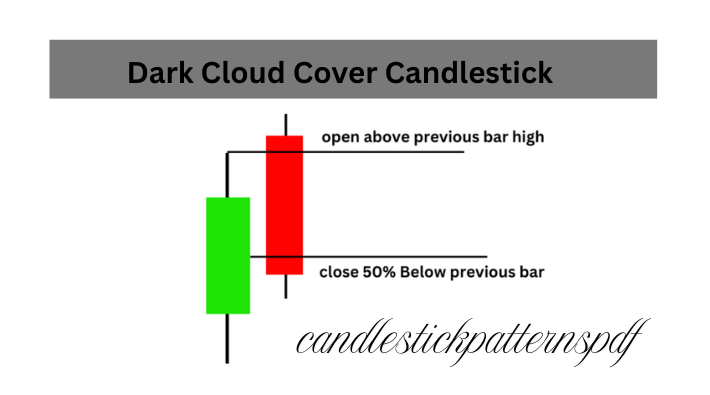
To correctly identify a Dark Cloud Cover pattern, look for these specific characteristics:
- Preceding Uptrend: The pattern must form after a clear uptrend, as it’s a reversal signal, not a continuation pattern.
- First Candle: A long bullish candle with a substantial body, representing strong buying pressure.
- Second Candle: A bearish candle that opens above the high of the first candle (creating a gap up) but closes well into the body of the previous candle.
- Depth of Penetration: The close of the second candle should be below the midpoint of the first candle’s body. The deeper the penetration, the stronger the reversal signal.
- Volume Confirmation: Higher-than-average volume on the second (bearish) candle adds credibility to the pattern.
The psychological interpretation behind this pattern is straightforward: bulls were initially in control, pushing prices to new highs, but bears suddenly overpowered them, causing a significant price drop. This dramatic shift often leads to further selling pressure in subsequent trading sessions.
Variants of the Dark Cloud Cover Candlestick Pattern
While the classic Dark Cloud Cover follows the criteria mentioned above, several variations of this pattern exist:
- Piercing Line: The bullish counterpart to the Dark Cloud Cover. It forms during a downtrend with a bearish candle followed by a bullish candle that closes above the midpoint of the previous candle.
- Evening Doji Star: A three-candle pattern where the middle candle is a doji (small body with upper and lower shadows). It’s considered a stronger reversal signal than the Dark Cloud Cover.
- Shallow Dark Cloud: When the second candle closes in the upper half of the first candle’s body. This is considered a weaker signal but still maintains bearish implications.
- Deep Dark Cloud: When the second candle closes below the opening of the first candle. This represents an extremely bearish scenario and often leads to a strong downtrend.
- Dark Cloud in Consolidation: Forms during a sideways market rather than an uptrend. Though less reliable, it can still indicate short-term selling pressure.
Understanding these variations helps traders adapt their strategies to different market conditions and find opportunities that others might miss.
How To Trade The Dark Cloud Cover Candlestick Pattern
Trading the Dark Cloud Cover effectively requires a systematic approach. Here’s a comprehensive framework:
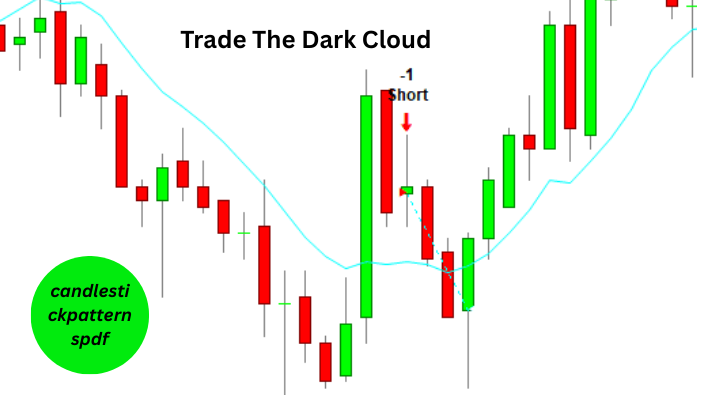
Entry Conditions:
- Wait for the pattern to fully form (both candles complete)
- Confirm the pattern with additional technical indicators
- Enter short positions at the open of the next candle after the pattern
- For conservative traders, wait for a break below the low of the second candle
Stop Loss Placement:
- Place stop loss slightly above the high of the second candle
- Alternative: Set stop loss above the high of the first candle (wider but sometimes necessary in volatile markets)
Take Profit Targets:
- First target: Previous support level
- Second target: 100% of the height of the two candles in the pattern
- Third target: Next major support zone
Risk Management:
- Never risk more than 1-2% of your trading capital on a single trade
- Consider reducing position size in highly volatile markets
- Use partial profit taking to secure gains while letting winners run
Now, let’s explore specific strategies to maximize your success when trading this pattern.
Strategies To Trade The Dark Cloud Cover Candlestick Pattern
Strategy 1: Pullbacks On Naked Charts
The “naked chart” approach focuses on clean price action without the distraction of numerous indicators. Here’s how to implement it:
- Identify the Dark Cloud Cover on a clean price chart
- Look for previous swing levels that could act as support or resistance
- Enter short positions when price pulls back slightly after the pattern forms
- Set stop loss above the high of the pattern
- Target the nearest support level for profit-taking
This strategy works best in markets with clear trending behavior and well-defined swing points. The simplicity of this approach makes it ideal for traders who prefer to focus on pure price action.
Strategy 2: Trading The Dark Cloud Cover With Resistance Levels
Combining the Dark Cloud Cover with resistance levels significantly increases its reliability:
- Identify important resistance zones on your chart (previous highs, round numbers, etc.)
- Look for the Dark Cloud Cover pattern forming at or near these resistance levels
- Enter short positions when both the pattern and resistance confirm each other
- Set a tight stop loss above the resistance level
- Target the next major support zone
This strategy benefits from the confluence of two powerful technical signals. When a Dark Cloud Cover forms precisely at a resistance level, it often leads to a stronger reversal than the pattern alone would suggest.
Strategy 3: Trading The Dark Cloud Cover With Moving Averages
Moving averages provide dynamic support and resistance levels that pair excellently with candlestick patterns:
- Add 20 and 50-period exponential moving averages (EMAs) to your chart
- Look for the Dark Cloud Cover pattern forming near the 20 EMA after an uptrend
- Confirm that price is trading above both moving averages (indicating an uptrend)
- Enter a short position when price breaks below the 20 EMA after the pattern forms
- Set stop loss above the pattern’s high
- Target the 50 EMA as your first profit objective
This strategy works particularly well in trending markets where moving averages effectively define the trend’s strength and direction.
Strategy 4: Trading The Dark Cloud Cover With RSI Divergences
Relative Strength Index (RSI) divergences combined with the Dark Cloud Cover create powerful trading signals:
- Identify a Dark Cloud Cover pattern at the end of an uptrend
- Check if the RSI indicator shows bearish divergence (price makes higher highs while RSI makes lower highs)
- Enter short positions when both signals align
- Set stop loss above the pattern’s high
- Target previous support levels or use the RSI oversold condition (below 30) as an exit signal
The combination of price action and momentum divergence provides a high-probability trade setup that often leads to significant price movements.
Strategy 5: Trading The Dark Cloud Cover With Fibonacci Retracements
Fibonacci retracement levels help identify potential reversal zones that complement the Dark Cloud Cover:
- Draw Fibonacci retracement levels from a significant low to the high before the pattern
- Look for the Dark Cloud Cover forming near key Fibonacci levels (61.8%, 78.6%)
- Enter short positions when the pattern completes at these levels
- Set stop loss slightly above the Fibonacci level where the pattern formed
- Target the next Fibonacci level below (50%, 38.2%, etc.) for profit-taking
This strategy works well in trending markets with clear wave structures, allowing traders to identify high-probability reversal zones.
Strategy 6: Trading The Dark Cloud Cover With Pivot Points
Pivot points provide objective support and resistance levels that enhance the Dark Cloud Cover signal:
- Calculate daily pivot points (PP, R1, R2, S1, S2)
- Look for the Dark Cloud Cover pattern forming at or near R1 or R2 resistance levels
- Enter short positions when price confirms the reversal by breaking below the pivot point
- Set stop loss above the high of the pattern
- Target S1 or S2 support levels for profit-taking
This strategy combines mathematical price levels with candlestick psychology, creating a robust trading approach that works across various market conditions.
This Is What You Learned Today
The Dark Cloud Cover pattern stands as one of the most reliable bearish reversal signals in technical analysis. Let’s recap what we’ve covered:
- The Dark Cloud Cover is a two-candle pattern consisting of a bullish candle followed by a bearish candle that closes below the midpoint of the first candle’s body
- It signals a potential shift from bullish to bearish market sentiment
- Proper identification requires attention to the preceding trend, opening and closing prices, and the depth of penetration
- Various trading strategies can enhance the pattern’s effectiveness, including combinations with support/resistance, moving averages, RSI divergences, Fibonacci levels, and pivot points
- Risk management remains crucial when trading any pattern, including appropriate stop loss placement and profit targets
Remember that no pattern works 100% of the time. The Dark Cloud Cover should be used as part of a comprehensive trading plan that includes proper risk management and consideration of the broader market context.
By mastering this powerful candlestick pattern and the strategies to trade it effectively, you’ve added a valuable tool to your technical analysis toolkit. The next time dark clouds gather on your price charts, you’ll be well-prepared to navigate the changing market weather.
Disclaimer: Trading involves risk. The strategies outlined in this article are for educational purposes only. Always conduct your own research and consider consulting with a financial advisor before making trading decisions.


