Mastering the Bearish Engulfing Pattern
In the world of technical analysis, few signals capture a market reversal as dramatically as the bearish engulfing pattern. This powerful candlestick formation serves as a warning signal for traders, potentially indicating that a bullish trend is losing momentum and a reversal might be imminent. Understanding how to identify, interpret, and trade this pattern can give you a significant edge in your investment decisions.
1. Bearish Engulfing Pattern: Definition and Example of How To Use
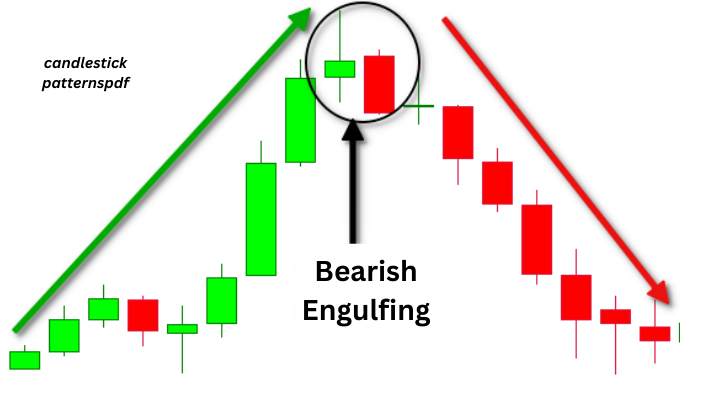
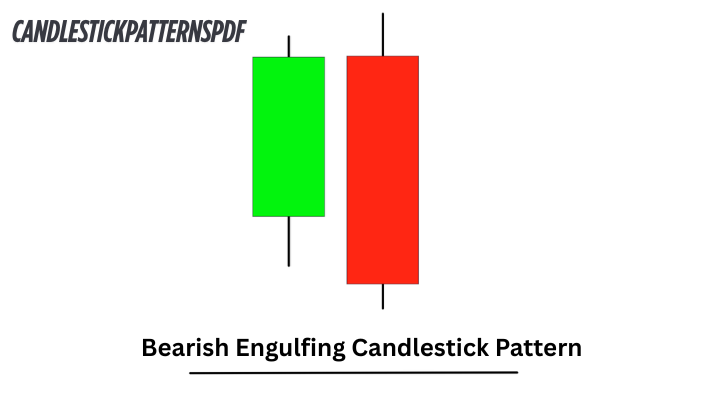
A bearish engulfing pattern consists of two candlesticks: first, a smaller bullish (green or white) candle, followed by a larger bearish (red or black) candle that completely “engulfs” the body of the previous day’s candle. This pattern typically forms at the end of an uptrend and signals potential trend reversal.
For a true bearish engulfing pattern:
- The market must be in an established uptrend
- The first candle must be bullish (close higher than open)
- The second candle must be bearish (close lower than open)
- The second candle’s body must completely engulf the body of the first candle (shadows/wicks don’t necessarily need to be engulfed)
When using this pattern, traders typically look for confirmation through increased trading volume on the engulfing candle and additional bearish signals in the following sessions.
2. Interpreting the Bearish Engulfing Pattern
The bearish engulfing pattern represents a significant shift in market sentiment from bullish to bearish. It tells a clear story: buyers were initially in control (first candle), but sellers overwhelmed them in the subsequent period (second candle).
What makes this pattern particularly powerful is the visual representation of strength. The second candle doesn’t just indicate a bearish day—it completely overshadows the previous bullish movement, suggesting that selling pressure has significantly intensified.
When interpreting this pattern, consider:
- The size of the engulfing candle (larger candles indicate stronger selling pressure)
- The location (patterns at key resistance levels or after extended rallies carry more weight)
- The overall market context (is the pattern forming against the primary trend or with it?)
- Trading volume (higher volume on the engulfing candle increases reliability)
3. The Psychology Behind the Bearish Engulfing Pattern
The bearish engulfing pattern represents a dramatic shift in market psychology. Here’s what’s happening beneath the surface:
During the first candle, buyers are still in control, pushing prices higher and maintaining the uptrend. Market sentiment is positive, and traders are confident in further upside potential.
The second candle reveals a sudden change—sellers enter aggressively, overwhelming buying pressure. This can happen for various reasons:
- Profit-taking after an extended rally
- News or events triggering uncertainty
- Technical resistance levels being reached
- Large institutional investors beginning to exit positions
The psychological impact is significant: bullish traders become uncertain, new buyers hesitate to enter, and bearish traders gain confidence. This shift in sentiment can become self-reinforcing, leading to the trend reversal the pattern predicts.
4. Trading the Bearish Engulfing Pattern
To effectively trade the bearish engulfing pattern, follow these steps:
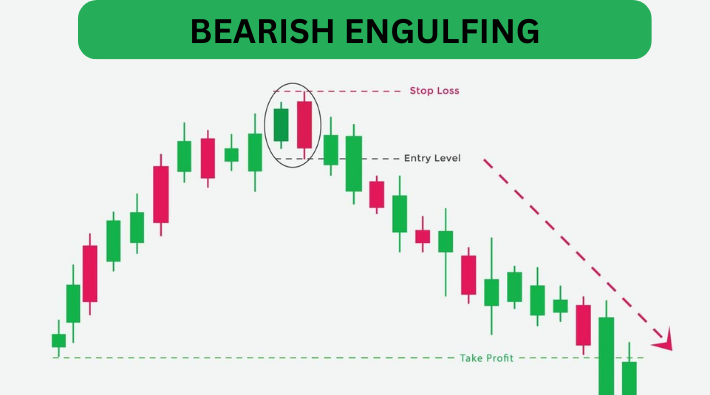
Entry Strategy:
- Identify the pattern in an uptrend
- Wait for confirmation (next candle closing lower, increased volume, or other technical indicators)
- Enter a short position after confirmation
- Set a stop-loss slightly above the high of the engulfing candle
Exit Strategy:
- Set profit targets at previous support levels
- Consider using Fibonacci retracement levels (38.2%, 50%, 61.8%)
- Trail stops as the price moves in your favor
- Exit if a strong bullish reversal pattern forms
Risk Management:
- Size positions appropriately (risking no more than 1-2% of your trading capital)
- Consider the risk-to-reward ratio (aim for at least 1:2)
- Be aware of upcoming news or earnings events that could impact price
Complementary Indicators:
- Relative Strength Index (RSI) showing overbought conditions
- Volume spike on the engulfing candle
- Divergence between price and momentum indicators
- Pattern forming at key resistance levels or trendlines
5. The Pros and Cons of Using the Bearish Engulfing Pattern
Pros:
- Visual clarity: The pattern is easy to identify even for beginners
- Strong psychological signal: Represents a clear shift in market sentiment
- Versatility: Works across different markets (stocks, forex, commodities, cryptocurrencies)
- Timely signal: Provides early warning of potential trend changes
- Adaptable to timeframes: Effective on both daily charts and intraday timeframes
Cons:
- False signals: Can occur, especially in choppy or range-bound markets
- Confirmation required: Trading without confirmation increases risk
- Context dependent: Less reliable when not aligned with the broader trend
- Timing challenges: Early entry can result in drawdowns if the reversal is slow
- Subjectivity: Some patterns may not perfectly fit the traditional definition
6. An Example of the Bearish Engulfing Pattern
Let’s examine a real-world example of the bearish engulfing pattern and how it played out:
Imagine a tech stock that has been in an uptrend for several months, gaining 25% over that period. The stock reaches a new high, and the following day forms a small bullish candle, suggesting continued momentum. However, the next day opens higher but then faces intense selling pressure, closing well below the previous day’s open—forming a textbook bearish engulfing pattern.
The subsequent price action confirms the reversal signal:
- Volume on the engulfing day is twice the average daily volume
- The RSI indicator, previously in overbought territory, begins declining
- The following three sessions all close lower
- The price breaks below the 20-day moving average for the first time in months
A trader who recognized this pattern could have:
- Entered a short position after the engulfing pattern formed
- Set a stop-loss above the high of the engulfing candle
- Targeted the nearest support level for profit-taking
- Potentially captured a 10-15% downside move
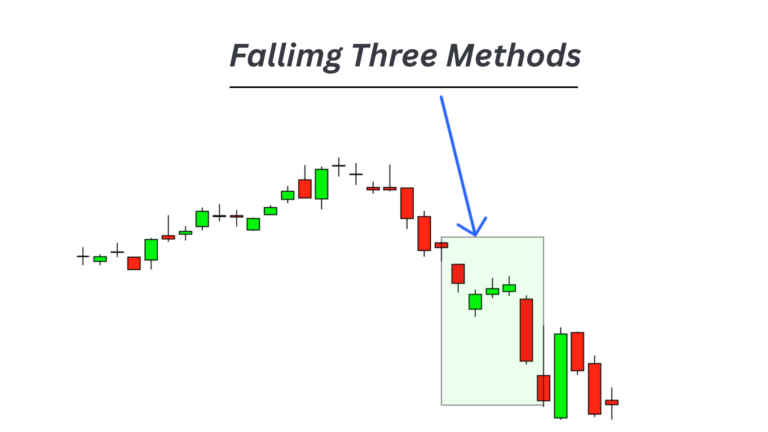
7. Are There Any Other Chart Patterns Like the Bearish Engulfing Pattern?
Several other candlestick patterns share similarities with the bearish engulfing pattern:
Dark Cloud Cover: Similar to bearish engulfing but the second candle only engulfs part (typically more than 50%) of the previous candle’s body.
Evening Star: A three-candle pattern where a small candle forms after an uptrend, followed by a gap up and then a large bearish candle that moves down into the body of the first candle.
Shooting Star: A single candlestick with a small body at the bottom and a long upper shadow, indicating rejection of higher prices.
Bearish Harami: The opposite structure of engulfing—a large bullish candle followed by a smaller bearish candle contained within the body of the first.
Three Black Crows: Three consecutive bearish candles with each opening within the previous candle’s real body and closing near their lows.
While each pattern has its unique characteristics, they all indicate potential bearish reversals. The bearish engulfing stands out for its clear visual representation of sellers overwhelming buyers in a single session.
8. What Are the Similarities Between Bar Charts and Candlestick Charts?
Bar charts and candlestick charts share fundamental similarities while differing in visual representation:
Similarities:
- Both display the same price information (open, high, low, close)
- Both can be used to identify price patterns and trends
- Both represent the same time periods (daily, hourly, etc.)
- Both can be used with supplementary indicators (volume, moving averages)
- Both show market psychology through price movement
The primary difference lies in visual presentation. Candlesticks emphasize the relationship between opening and closing prices through colored bodies, making patterns like the bearish engulfing more visually apparent. Bar charts use vertical lines with small horizontal ticks to show the same information but in a less visually distinct manner.
A bearish engulfing pattern can be identified on a bar chart when a bullish bar (close higher than open) is followed by a larger bearish bar (close lower than open) that exceeds both the high and low of the previous bar. However, the visual impact is much stronger on candlestick charts.
9. How Reliable Is the Bearish Engulfing Pattern?
The reliability of the bearish engulfing pattern varies depending on context and confirmation:
Research suggests:
- The pattern has approximately a 65-75% reliability rate when formed in an established uptrend
- Reliability increases to 80%+ when accompanied by high volume
- Patterns forming at key resistance levels or after extended rallies are more reliable
- Larger engulfing candles tend to produce more significant reversals
Factors affecting reliability:
- Market conditions: More reliable in trending markets than choppy or range-bound conditions
- Timeframe: Generally more reliable on longer timeframes (daily, weekly) than very short ones
- Market type: Performance varies across different markets (stocks, forex, commodities)
- Overall trend: Counter-trend signals are less reliable than those aligned with the primary trend
To maximize reliability, experienced traders don’t rely solely on the pattern itself but look for confluence with other technical factors and confirmation signals.
10. How Do I Confirm the Bearish Engulfing Pattern Signal?
Confirming a bearish engulfing pattern is crucial for increasing trading success. Here are effective confirmation methods:
Price Action Confirmation:
- The third candle closes below the engulfing candle’s close
- A break below the low of the engulfing candle
- Follow-through selling in subsequent sessions
Volume Confirmation:
- Significantly higher volume on the engulfing candle compared to recent average
- Continued high volume on follow-through selling days
Technical Indicator Confirmation:
- RSI showing overbought conditions or negative divergence
- MACD crossing below its signal line
- Stochastic oscillator showing a bearish crossover from overbought territory
Support/Resistance Confirmation:
- Pattern forming at a major resistance level
- Break of a key trendline following the pattern
- Failure to make a new high after the pattern forms
Market Breadth Confirmation:
- Declining advance-decline ratios in the broader market
- Increase in new lows versus new highs
- Deteriorating market sentiment indicators
Ideally, you’ll want to see multiple confirmation signals before taking a position based on the bearish engulfing pattern.
11. What Is the Best Time Frame To Use for the Bearish Engulfing Pattern?
The bearish engulfing pattern can be effective across multiple timeframes, but certain considerations apply:
Daily Charts (Most Common):
- Provides balanced view of market sentiment
- Filters out intraday noise
- Generally more reliable signals
- Suitable for swing trading approaches
- Allows time for proper analysis and decision-making
Weekly Charts:
- Highest reliability for major trend reversals
- Signals often precede substantial moves
- Lower frequency of signals
- Better for position trading or longer-term investing
- Requires more patience and larger stop-losses
Intraday Charts (1-Hour, 4-Hour):
- More frequent trading opportunities
- Smaller moves and profit potential
- Higher likelihood of false signals
- Better for day traders or active traders
- Requires more immediate attention and management
Very Short Timeframes (5-15 Minutes):
- Least reliable application of the pattern
- Subject to market noise and whipsaws
- Only recommended for experienced traders
- Requires strict confirmation rules
- Best used in conjunction with other technical factors
The optimal timeframe ultimately depends on your trading style, capital size, risk tolerance, and availability to monitor the markets. Many successful traders focus on daily charts for primary analysis while using shorter timeframes for entry timing.
Conclusion
The bearish engulfing pattern stands as one of the most powerful reversal signals in technical analysis. Its visual clarity, psychological underpinnings, and practical application make it a valuable tool for traders across markets and timeframes.
To master this pattern:
- Learn to identify it correctly within its proper context
- Develop a systematic approach to confirmation
- Implement sound risk management rules
- Practice recognizing the pattern in historical charts
- Start with paper trading before committing real capital
Remember that no pattern works 100% of the time. The bearish engulfing pattern should be one tool in your broader trading strategy, used in conjunction with other forms of analysis and always with appropriate risk management.
By understanding the nuances of this pattern—from its formation to its psychological implications—you can better anticipate potential market turns and position your trades accordingly. Whether you’re a day trader seeking short-term opportunities or a position trader looking for major trend changes, the bearish engulfing pattern offers valuable insights into market dynamics.