Shooting Star: What It Means in Stock Trading, With an Example
In the world of technical analysis, traders rely on various chart patterns to make informed decisions. One such powerful pattern is the Shooting Star – a bearish reversal candlestick formation that signals potential downward price movements.
This article explores the meaning, identification, trading strategies, and limitations of the Shooting Star pattern to help traders recognize and capitalize on this market signal.
Understanding the Shooting Star Pattern
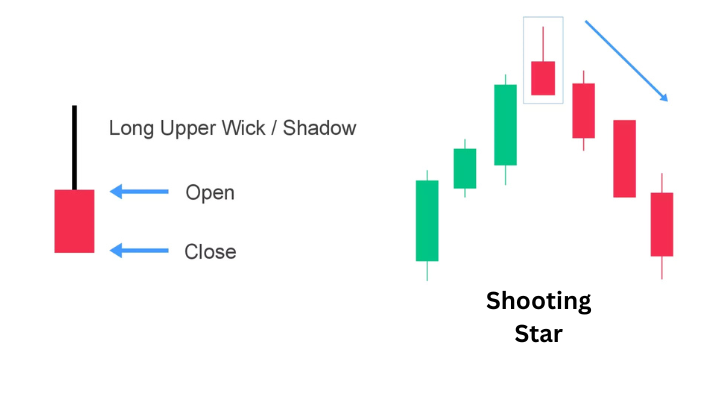
The Shooting Star is a single candlestick pattern characterized by:
- A small real body (the difference between opening and closing prices)
- Little to no lower shadow (wick)
- A long upper shadow that is typically at least twice the length of the real body
- The formation appears at the end of an uptrend, suggesting that buyers initially pushed prices higher but eventually lost control to sellers
Visually, it resembles a shooting star with a tail pointing upward – hence the name. The long upper shadow indicates that buyers temporarily drove prices higher during the session, but sellers ultimately forced prices back down near the opening level, indicating a potential shift in market sentiment from bullish to bearish.
Confirming the Shooting Star Pattern
A Shooting Star isn’t definitive on its own. Successful traders look for confirmation before acting on this signal:
- Prior Trend: A Shooting Star must appear after an established uptrend to be considered a reversal pattern.
- Volume: Higher than average trading volume during the Shooting Star formation strengthens its validity, suggesting stronger seller presence.
- Next Day Confirmation: A bearish candle (closing lower than the Shooting Star’s close) or gap down on the following trading day confirms the reversal signal.
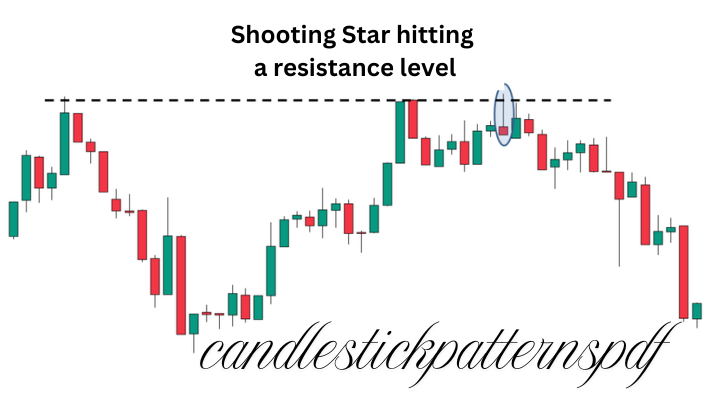
- Support/Resistance Levels: A Shooting Star that forms at a significant resistance level adds credibility to the pattern.
How to Trade a Shooting Star Pattern
When you identify a confirmed Shooting Star pattern, consider the following trading approach:
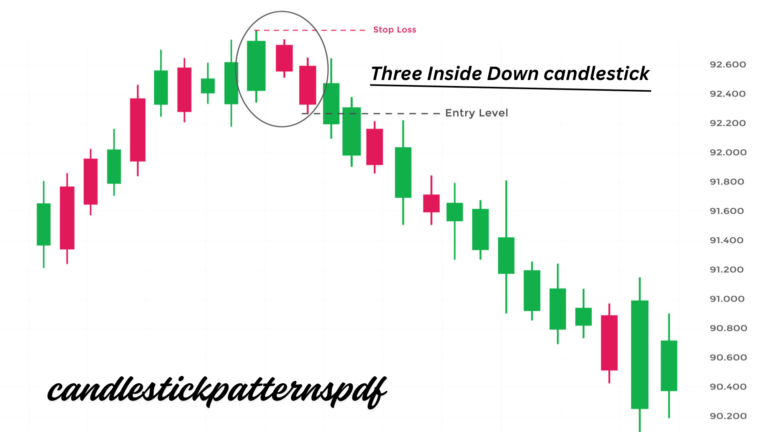
Entry Point: Enter a short position after confirmation (typically on the next candle after the Shooting Star).
Stop Loss: Place a stop-loss order slightly above the high of the Shooting Star candle to limit potential losses if the pattern fails.
Take Profit: Set profit targets at previous support levels or use a risk-reward ratio (many traders aim for at least 2:1 – meaning the potential profit is twice the risk taken).
Example:
Let’s consider a practical example of trading the Shooting Star pattern with Apple Inc. (AAPL) stock:
Imagine AAPL has been in an uptrend for several weeks, climbing from $150 to $180. On Friday, AAPL opens at $179, rises to $186 during the day, but closes at $180, forming a Shooting Star candlestick with a small body and long upper shadow.
On Monday, AAPL opens lower at $178 and continues declining, confirming the bearish reversal signal.
As a trader who identified this pattern:
- You could enter a short position at $178 after confirmation
- Set a stop-loss at around $187 (just above the high of the Shooting Star)
- Target a take-profit at $168 (previous support level)
This trade would have a risk of $9 per share with a potential reward of $10 per share.
Common Mistakes and Limitations
Despite its usefulness, traders should be aware of these potential pitfalls:
- Isolated Analysis: Relying solely on the Shooting Star without considering other technical indicators or market conditions.
- Ignoring Volume: Trading the pattern without confirming significant volume, which may lead to false signals.
- Counter-Trend Trading: Shooting Stars indicate potential reversals, but trading against a strong trend can be risky without solid confirmation.
- Market Context: During highly volatile markets or major news events, candlestick patterns may be less reliable.
- Timeframe Sensitivity: A Shooting Star on a daily chart carries more significance than one on a 5-minute chart.
Shooting Star vs. Inverted Hammer
Traders often confuse the Shooting Star with the Inverted Hammer pattern due to their similar appearance. The key differences are:
- Context: The Shooting Star appears in uptrends (bearish signal), while the Inverted Hammer appears in downtrends (bullish signal).
- Psychology: The Shooting Star represents buyers losing control to sellers, while the Inverted Hammer suggests buyers testing seller resolve in a downtrend.
- Confirmation: For a Shooting Star, confirmation is bearish follow-through; for an Inverted Hammer, bullish confirmation is needed.
Trade on the Go. Anywhere, Anytime
Modern trading platforms have made it easier than ever to identify and trade candlestick patterns like the Shooting Star. Mobile applications offer:
- Real-time chart analysis
- Pattern recognition tools
- Customizable alerts for when potential Shooting Stars form
- Quick trade execution from anywhere
This accessibility allows traders to capitalize on these signals even when away from their desks, though careful analysis should never be sacrificed for convenience.
Conclusion
The Shooting Star pattern offers traders a valuable tool for identifying potential market reversals. When properly confirmed and used in conjunction with other technical analysis methods, it can provide timely entry and exit signals. However, like all technical patterns, it’s not infallible and works best as part of a comprehensive trading strategy.
Remember that successful trading involves more than just pattern recognition—risk management, discipline, and an understanding of broader market conditions are equally important. By mastering the Shooting Star pattern while avoiding common pitfalls, traders can add another effective technique to their analytical arsenal.