The Bearish Harami Pattern: A Complete Guide to Trading This Reversal Signal
Introduction
In the world of technical analysis, candlestick patterns serve as powerful tools for predicting market movements and identifying potential trading opportunities. Among these patterns, the bearish harami stands out as one of the most reliable reversal signals that traders use to anticipate downward price movements. This Japanese candlestick pattern has been helping traders make informed decisions for centuries, offering insights into market psychology and potential trend changes.
Understanding the bearish harami pattern is crucial for any trader looking to improve their technical analysis skills and develop more effective trading strategies. This comprehensive guide will explore every aspect of the bearish harami, from its basic structure to advanced trading applications, helping you recognize and capitalize on this important reversal pattern.
What Is a Bearish Harami?
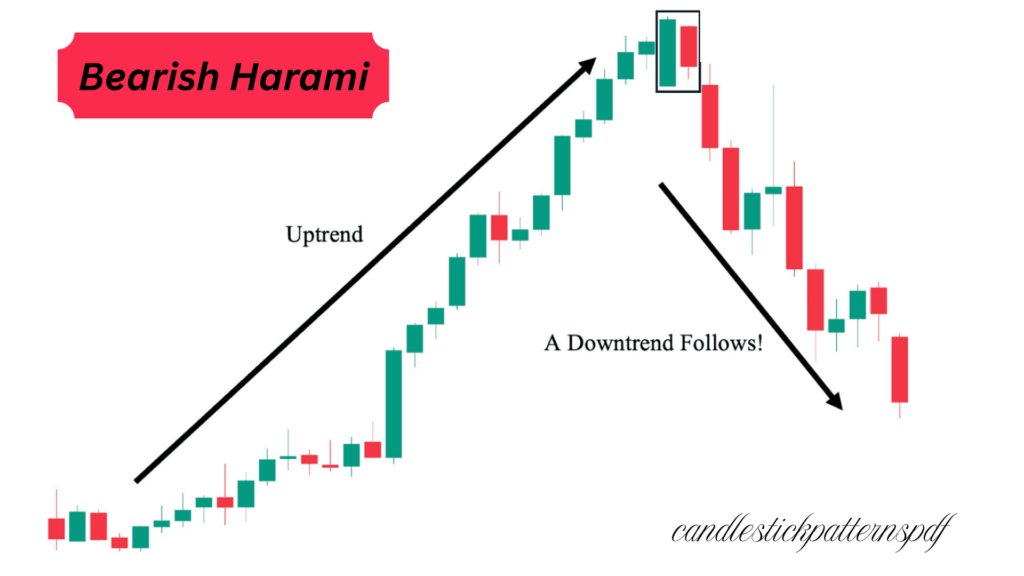
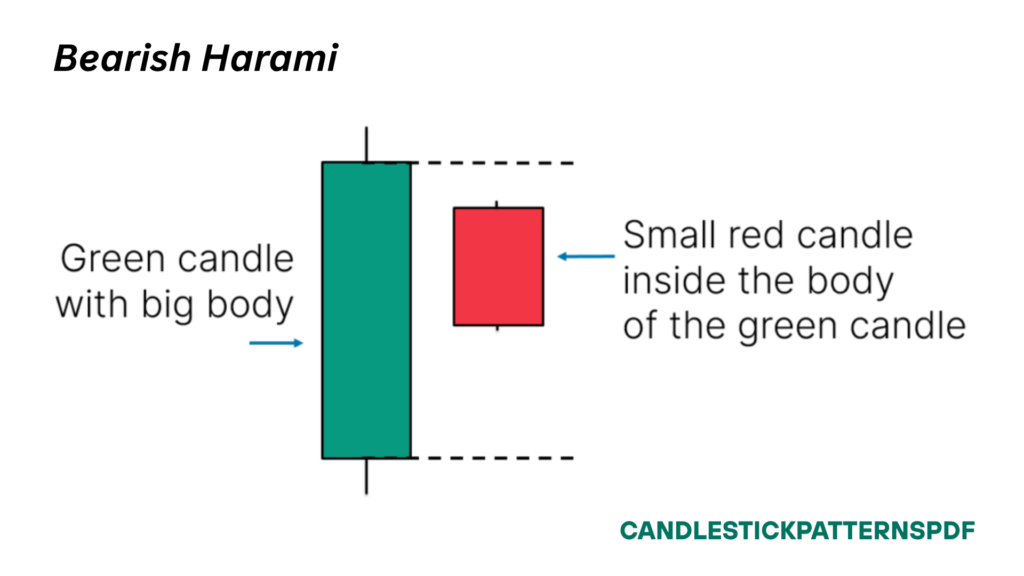
A bearish harami is a two-candlestick reversal pattern that typically appears at the end of an uptrend, signaling a potential shift from bullish to bearish sentiment. The term “harami” originates from the Japanese word meaning “pregnant,” which aptly describes the visual appearance of this pattern where a smaller candle appears to be contained within the body of a larger preceding candle.
The bearish harami consists of two distinct candles: the first is a large bullish (green or white) candle that continues the existing uptrend, followed by a smaller bearish (red or black) candle whose body is completely contained within the real body of the first candle. This formation suggests that the buying momentum that drove the previous uptrend is beginning to weaken, potentially leading to a price reversal.
This pattern is considered a warning signal rather than an immediate call to action, as it indicates indecision in the market and suggests that the current uptrend may be losing steam. Traders often wait for additional confirmation before making trading decisions based solely on a bearish harami pattern.
What Are the Key Characteristics of the Bearish Harami Pattern?
The bearish harami pattern has several defining characteristics that traders must understand to identify it correctly:
Structure Requirements: The pattern must consist of exactly two candles, with the first being a large bullish candle and the second being a smaller bearish candle. The second candle’s real body must be completely engulfed by the first candle’s real body, though the shadows (wicks) can extend beyond the first candle’s body.
Trend Context: For the pattern to be valid, it must appear after a significant uptrend. The bearish harami loses its predictive power when it appears in sideways markets or during downtrends, as it specifically signals the potential end of bullish momentum.
Size Relationship: The first candle should be notably larger than the second candle, demonstrating strong initial buying pressure followed by reduced conviction. The greater the size difference between the two candles, the more significant the pattern becomes.
Color Contrast: The first candle must be bullish (typically green or white), while the second candle must be bearish (typically red or black). This color contrast represents the shift from buying to selling pressure within the two-day period.
Volume Considerations: While not always necessary, higher volume on the first candle followed by lower volume on the second candle can strengthen the pattern’s reliability, indicating that the initial buying enthusiasm is not being sustained.
What Is the Psychological Explanation of Bearish Harami?
The bearish harami pattern reflects a fascinating interplay of market psychology and investor sentiment. Understanding the psychological dynamics behind this pattern can help traders better interpret its significance and make more informed trading decisions.
During the formation of the first candle, bulls are in complete control of the market. Strong buying pressure drives prices significantly higher, creating a large bullish candle that reinforces the existing uptrend. This represents peak optimism and confidence among buyers, who believe the upward momentum will continue.
However, the second day tells a different story. Despite opening near the previous day’s close, the market fails to maintain its bullish momentum. Instead of continuing the upward trajectory, prices move lower, creating a bearish candle contained within the previous day’s range. This represents a critical shift in market sentiment.
The psychological significance lies in what this formation reveals about trader behavior. The smaller bearish candle indicates that bulls are losing conviction while bears are beginning to enter the market. The fact that prices couldn’t break above the previous day’s high, despite starting from a strong position, suggests that buying pressure is exhausting itself.
This pattern essentially captures the moment when the market transitions from confident buying to uncertainty and eventual selling pressure. It reflects the natural ebb and flow of market emotions, from greed and optimism to doubt and fear, making it a valuable tool for understanding market sentiment shifts.
What Does a Bearish Harami Indicate?
The bearish harami serves as an early warning system for potential trend reversals, providing traders with valuable insights into changing market dynamics. When this pattern appears, it indicates several important market conditions that traders should consider.
Weakening Bullish Momentum: The primary indication of a bearish harami is that the current uptrend is losing strength. The inability of bulls to push prices higher on the second day, despite favorable starting conditions, suggests that buying pressure is diminishing.
Increased Market Indecision: The pattern reflects growing uncertainty among market participants. Neither bulls nor bears have complete control, creating a state of equilibrium that often precedes significant price movements.
Potential Trend Reversal: While not guaranteeing an immediate reversal, the bearish harami suggests that the probability of a downward price movement has increased significantly. It serves as an alert for traders to prepare for potential selling opportunities.
Distribution Phase: The pattern may indicate that smart money is beginning to distribute their positions, selling into strength while retail investors continue buying. This creates the conditions for a eventual price decline once selling pressure overwhelms buying interest.
Risk Management Signal: For traders holding long positions, the bearish harami serves as a signal to tighten stop losses or consider taking profits, as the risk of a price reversal has increased substantially.
What Is an Example of a Bearish Harami?
To illustrate how a bearish harami pattern works in practice, consider a stock that has been in a strong uptrend for several weeks, consistently making higher highs and higher lows. The stock opens on Monday morning and experiences strong buying pressure throughout the day, closing significantly higher than its opening price and creating a large bullish candle.
On Tuesday, the stock opens near Monday’s closing price, maintaining the positive sentiment from the previous day. However, as the trading session progresses, selling pressure begins to emerge. Instead of continuing higher, the stock starts to decline, ultimately closing lower than its opening price but still within Monday’s trading range. This creates a smaller bearish candle that is completely contained within Monday’s bullish candle.
In this example, the large bullish candle on Monday represents the continuation of the existing uptrend, with buyers showing strong conviction. However, Tuesday’s action tells a different story. Despite starting from a strong position, the stock couldn’t maintain its upward momentum, instead closing lower and forming the characteristic bearish harami pattern.
This formation would alert traders that the uptrend might be losing steam and that a potential reversal could be developing. Experienced traders would likely wait for additional confirmation, such as a gap down opening the following day or increased selling volume, before acting on this signal.
The key to recognizing this pattern in real market conditions is understanding that it represents a shift in the balance of power between buyers and sellers, marking a critical inflection point in the stock’s price action.
What Is the Bearish Harami Strategy?
Developing an effective bearish harami trading strategy requires combining pattern recognition with proper risk management and confirmation techniques. A well-structured approach can help traders capitalize on this reversal pattern while minimizing potential losses.
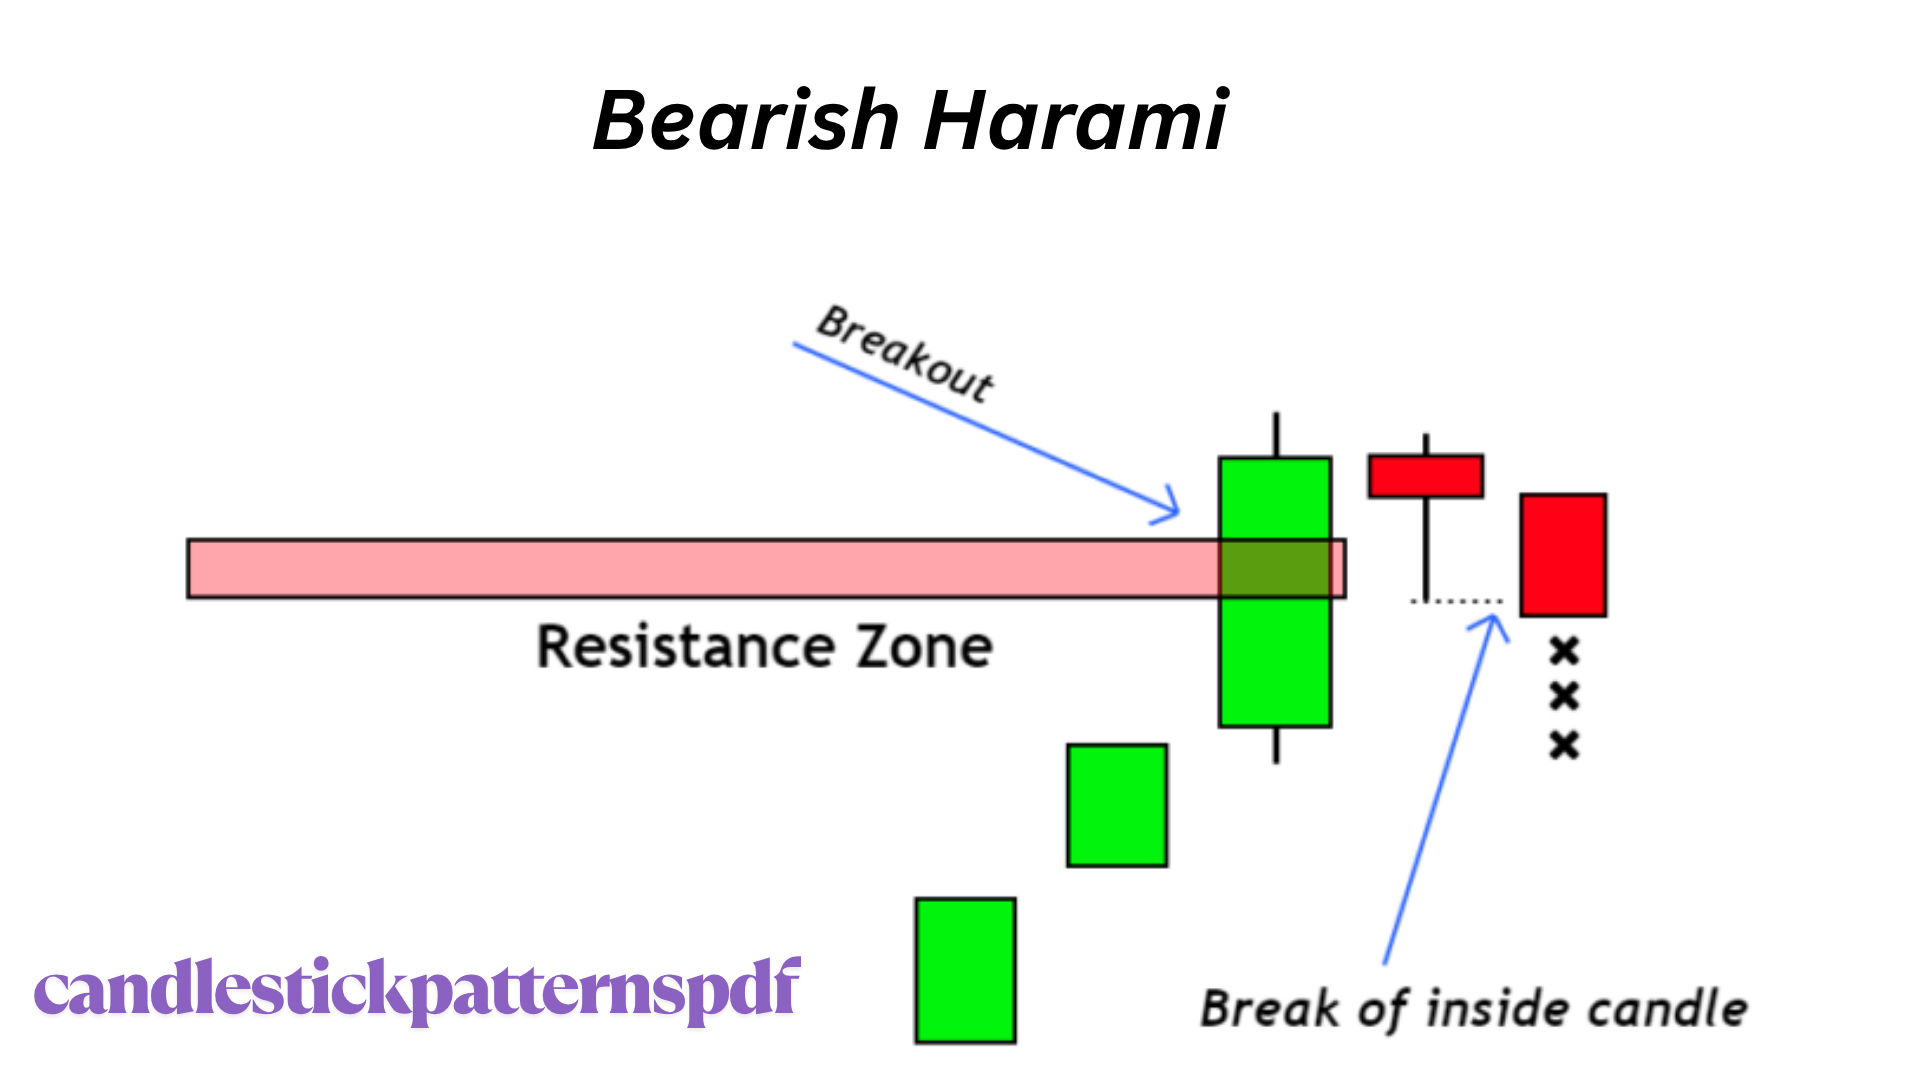
Entry Strategy: The most conservative approach is to wait for confirmation before entering a short position. This might involve waiting for the price to break below the low of the harami pattern or for additional bearish signals to emerge. More aggressive traders might enter positions immediately after the pattern completes, but this carries higher risk.
Stop Loss Placement: Effective risk management is crucial when trading bearish harami patterns. A logical stop loss level would be slightly above the high of the first candle in the pattern, as a break above this level would invalidate the bearish signal and suggest the uptrend is continuing.
Profit Targets: Traders can set profit targets based on various factors, including previous support levels, Fibonacci retracements, or a predetermined risk-reward ratio. Some traders prefer to scale out of positions as the stock declines, taking partial profits at predetermined levels.
Volume Confirmation: Incorporating volume analysis can strengthen the strategy. Look for decreasing volume on the second candle compared to the first, and increased volume on any subsequent bearish moves as confirmation of the pattern’s validity.
Multiple Timeframe Analysis: Analyzing the pattern across different timeframes can provide additional context and confirmation. A bearish harami on a daily chart combined with bearish signals on weekly charts creates a stronger case for a potential reversal.
Market Context: Consider the broader market environment when trading bearish harami patterns. During strong bull markets, these patterns may be less reliable, while during uncertain or bearish market conditions, they may prove more effective.
How Accurate Is the Bearish Harami Pattern?
The accuracy of the bearish harami pattern varies depending on several factors, including market conditions, timeframe, and the specific asset being analyzed. Understanding these variables is essential for traders who want to incorporate this pattern into their trading strategies effectively.
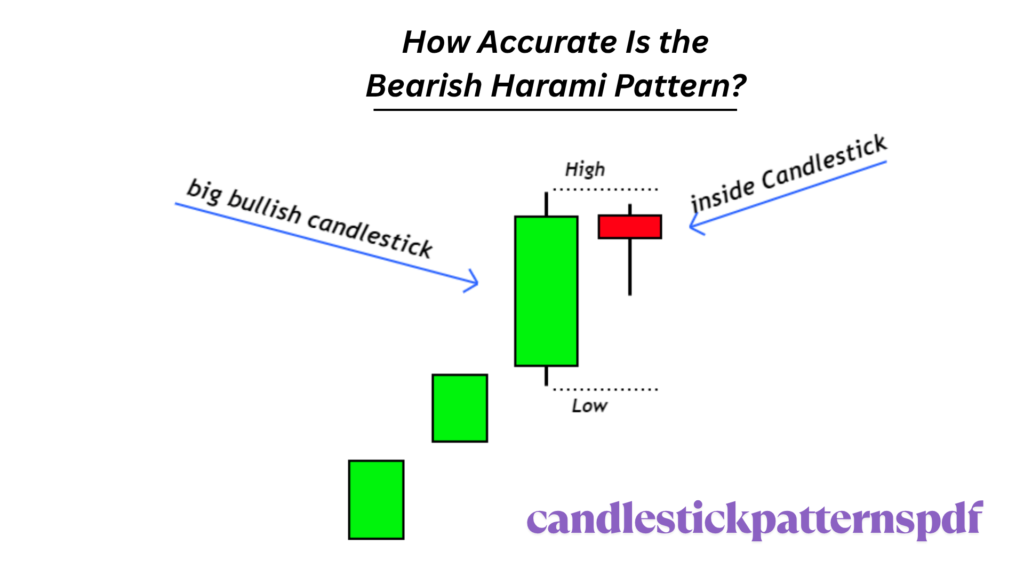
Research studies on candlestick pattern reliability suggest that the bearish harami has a moderate success rate, typically ranging from 55% to 65% when used in isolation. However, this accuracy can be significantly improved when combined with other technical indicators and confirmation signals.
Factors Affecting Accuracy: The pattern tends to be more reliable in certain market conditions. It performs better during periods of high volatility and in markets where technical analysis is widely followed. Additionally, the pattern’s accuracy improves when it appears after extended uptrends rather than short-term price movements.
Timeframe Considerations: Bearish harami patterns on longer timeframes, such as daily or weekly charts, tend to be more reliable than those on shorter intraday timeframes. This is because longer-term patterns reflect more substantial shifts in market sentiment and have more participants involved in their formation.
Confirmation Requirements: The accuracy significantly improves when traders wait for additional confirmation before acting on the pattern. This might include breaks below key support levels, bearish divergences in momentum indicators, or increased selling volume.
False Signals: Like all technical patterns, the bearish harami can produce false signals, particularly in strongly trending markets where the pattern may represent only temporary consolidation rather than a true reversal. Understanding these limitations is crucial for effective implementation.
Successful traders typically don’t rely solely on the bearish harami pattern but use it as one component of a comprehensive trading strategy that includes multiple forms of analysis and confirmation.
What Are the Limitations of the Bearish Harami Pattern?
While the bearish harami is a valuable technical analysis tool, it’s important to understand its limitations to avoid common trading mistakes and set realistic expectations for pattern-based trading strategies.
Timing Uncertainty: One of the primary limitations is that the pattern doesn’t provide specific timing for when the anticipated price decline will occur. The reversal might happen immediately, or the stock might continue trading sideways for an extended period before any significant movement occurs.
Magnitude Uncertainty: The pattern doesn’t indicate how far prices might fall following the signal. While it suggests a potential reversal, traders must use other tools to estimate price targets and determine appropriate position sizes.
False Breakouts: In strongly trending markets, what appears to be a bearish harami might actually be a brief pause before the uptrend continues. This is particularly common during powerful bull markets where temporary consolidation is mistaken for reversal signals.
Market Environment Dependence: The pattern’s effectiveness varies significantly with overall market conditions. During strong bull markets, bearish reversal patterns may be less reliable, while during bear markets, they might be more effective but also more common, reducing their predictive value.
Subjectivity in Identification: Different traders might interpret the same price action differently, leading to inconsistent pattern identification. What one trader sees as a valid bearish harami, another might dismiss due to slight variations in candle sizes or body relationships.
Need for Confirmation: The pattern rarely works well in isolation and typically requires additional confirmation from other technical indicators, volume analysis, or fundamental factors to be truly effective.
Understanding these limitations helps traders maintain realistic expectations and develop more robust trading strategies that don’t rely too heavily on any single pattern or indicator.
Why Are Volume and Movement Important for Bearish Harami?
Volume and price movement analysis play crucial roles in validating and strengthening bearish harami patterns, providing additional layers of confirmation that can significantly improve trading outcomes and pattern reliability.
Volume Confirmation Patterns: Ideal volume patterns for bearish harami formations typically show high volume on the first bullish candle, indicating strong buying interest, followed by lower volume on the second bearish candle, suggesting diminishing conviction among buyers. This volume pattern reinforces the psychological interpretation of the pattern.
Volume Expansion on Breakdown: When prices break below the harami pattern’s support level, increasing volume provides powerful confirmation that the reversal is genuine. High volume during the breakdown suggests that new sellers are entering the market and that the pattern is likely to follow through with continued downward movement.
Price Movement Context: The effectiveness of a bearish harami depends heavily on the preceding price movement. Patterns that form after extended uptrends with strong momentum are generally more reliable than those appearing after modest price increases or during sideways markets.
Post-Pattern Movement Analysis: The price action immediately following the harami pattern formation is critical for confirmation. Gaps down, immediate breaks below support, or continued lower closes strengthen the pattern’s validity and suggest higher probability of successful reversal trades.
Relative Volume Considerations: Comparing the volume during pattern formation to average volume over recent periods provides additional context. Patterns forming on above-average volume carry more weight than those appearing during quiet trading periods.
Movement Quality: The character of price movements within the pattern matters significantly. Clean, decisive moves with minimal wicks suggest stronger conviction than choppy price action with long shadows, which might indicate ongoing uncertainty rather than clear directional bias.
Should You Buy When It Is Bearish?
The question of whether to buy during bearish conditions, including when bearish harami patterns appear, is complex and depends on various factors including trading style, market outlook, and risk tolerance. Understanding different approaches can help traders make more informed decisions.
Contrarian Approach: Some experienced traders use bearish signals as buying opportunities, operating under the theory that markets often overreact to negative signals. This contrarian approach requires significant experience and strong risk management, as it involves fighting against established trends.
Value Investing Perspective: Long-term investors might view bearish patterns as opportunities to purchase quality assets at discounted prices. However, this approach requires fundamental analysis to ensure the underlying asset remains sound despite technical weakness.
Market Timing Considerations: The broader market environment significantly influences whether buying during bearish signals makes sense. During strong bull markets, bearish patterns might represent temporary corrections rather than major trend changes, potentially creating buying opportunities.
Risk Management Requirements: If choosing to buy during bearish conditions, implementing strict risk management becomes even more critical. This includes setting tight stop losses, limiting position sizes, and having clear exit strategies if the bearish scenario plays out as expected.
Pattern Context Analysis: The decision should also consider what type of bearish pattern is forming and its historical reliability in similar market conditions. Some patterns are more reliable than others, and understanding these nuances is crucial for making informed decisions.
Alternative Strategies: Rather than buying immediately when bearish patterns appear, traders might consider waiting for confirmation of reversal or looking for more favorable entry points at lower prices if the bearish scenario unfolds as anticipated.
The key is understanding that bearish patterns are signals to be cautious rather than automatic triggers for specific actions, and any trading decisions should align with overall strategy and risk tolerance.
What Is the Difference Between Bearish Harami and Bullish Harami?
Understanding the differences between bearish and bullish harami patterns is essential for traders who want to recognize both reversal opportunities and avoid confusion when analyzing charts. While these patterns share structural similarities, they have opposite implications and appear in different market contexts.
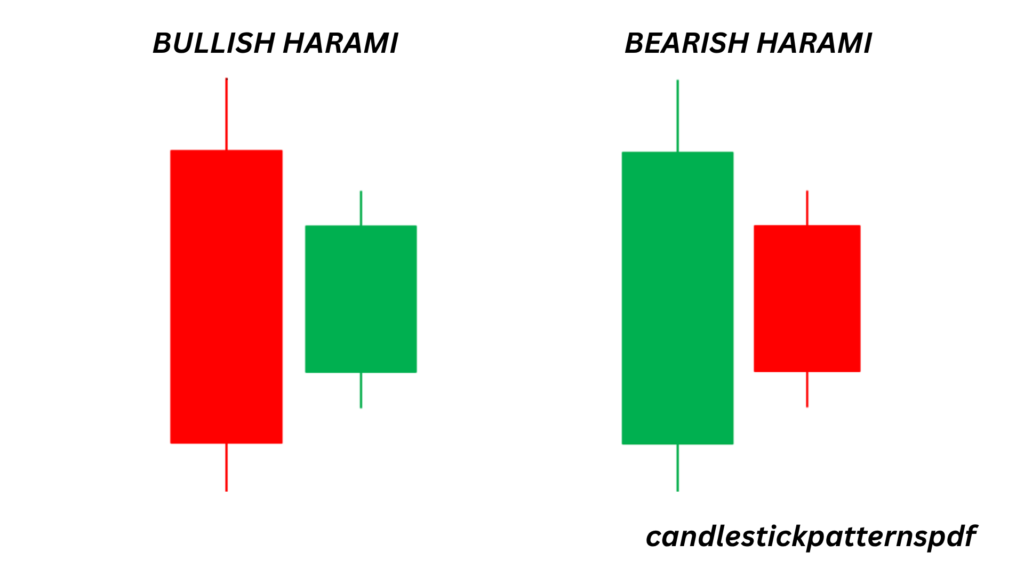
Structural Differences: The bullish harami appears at the end of downtrends and consists of a large bearish candle followed by a smaller bullish candle contained within the first candle’s body. This is the mirror image of the bearish harami, which appears after uptrends with a large bullish candle followed by a smaller bearish candle.
Market Context: Bearish harami patterns form during uptrends and suggest potential reversals to the downside, while bullish harami patterns develop during downtrends and indicate possible upward reversals. The trend context is crucial for proper pattern identification and interpretation.
Psychological Implications: The bearish harami reflects weakening bullish sentiment and growing uncertainty after a period of rising prices, while the bullish harami shows diminishing bearish pressure and emerging buying interest following a decline.
Trading Implications: Bearish harami patterns typically lead traders to consider short positions or profit-taking on long positions, while bullish harami patterns might prompt consideration of long positions or covering of short positions.
Confirmation Requirements: Both patterns benefit from similar types of confirmation, but the signals traders look for are opposite. Bearish harami confirmation includes breaks below support and increased selling volume, while bullish harami confirmation involves breaks above resistance and increased buying volume.
Reliability Factors: Both patterns have similar reliability challenges and benefit from additional technical analysis. However, their effectiveness can vary depending on overall market conditions, with bearish patterns potentially more reliable in uncertain markets and bullish patterns performing better during optimistic market environments.
Risk Management: Stop loss placement follows opposite logic for each pattern. Bearish harami trades typically place stops above the pattern high, while bullish harami trades place stops below the pattern low.
What Are the Different Types of Candlestick Patterns Aside from Bearish Harami?
The world of candlestick analysis extends far beyond the bearish harami, encompassing dozens of patterns that help traders identify potential market turning points and continuation signals. Understanding these various patterns provides traders with a comprehensive toolkit for technical analysis.
Single Candlestick Patterns: These include the doji, which indicates indecision with its small body and equal opening and closing prices; the hammer and hanging man, which have small bodies with long lower shadows; and the shooting star and inverted hammer, characterized by small bodies with long upper shadows. Each provides different insights into market sentiment and potential direction changes.
Two-Candlestick Patterns: Beyond the harami family, important two-candle patterns include the engulfing patterns (both bullish and bearish), where the second candle’s body completely engulfs the first candle’s body. The piercing line and dark cloud cover patterns are also significant, showing partial engulfment with specific opening and closing relationships.
Three-Candlestick Patterns: More complex patterns like the morning star and evening star involve three candles and typically provide stronger reversal signals. The three white soldiers and three black crows patterns indicate strong continuation signals in their respective directions.
Continuation Patterns: Not all candlestick patterns signal reversals. Rising and falling three methods, along with various flag and pennant formations in candlestick form, suggest that existing trends will continue after brief consolidation periods.
Complex Formations: Advanced patterns like the abandoned baby, island reversals, and various gap patterns provide sophisticated analysis tools for experienced traders who understand their nuances and requirements.
Pattern Combinations: Skilled traders often look for combinations of patterns or patterns that confirm signals from other technical indicators, creating more robust trading setups with higher probability outcomes.
Understanding this broader universe of candlestick patterns allows traders to develop more comprehensive analysis skills and avoid over-reliance on any single pattern type.
What Did Warren Buffett Do During a Bear Market?
Warren Buffett’s approach to bear markets provides valuable insights for investors dealing with bearish conditions, including those signaled by patterns like the bearish harami. His strategies during market downturns have consistently demonstrated the importance of long-term thinking and disciplined investing.
Opportunistic Buying: Buffett famously views bear markets as opportunities rather than threats, often increasing his buying activity when markets decline. His philosophy centers on the idea that bear markets allow investors to purchase quality companies at discounted prices, creating long-term wealth-building opportunities.
Focus on Fundamentals: Rather than relying on technical patterns or short-term market movements, Buffett emphasizes fundamental analysis during bear markets. He looks for companies with strong competitive advantages, capable management, and solid financial foundations that can weather economic storms.
Dollar-Cost Averaging: During prolonged bear markets, Buffett has employed systematic buying strategies, gradually building positions in favored companies as prices decline. This approach helps average down costs and takes advantage of market volatility.
Cash Preservation: Buffett maintains significant cash reserves during good times, allowing him to act decisively when bear market opportunities arise. This strategy provides flexibility and ensures liquidity when others face financial constraints.
Long-Term Perspective: His approach emphasizes ignoring short-term market volatility and focusing on long-term value creation. This perspective helps avoid emotional decision-making that often leads to poor outcomes during bear markets.
Selective Approach: Rather than buying indiscriminately during market declines, Buffett remains selective, focusing on companies he understands well and that meet his strict investment criteria.
Patience and Discipline: Buffett’s bear market success stems largely from his patience and discipline, waiting for the right opportunities and avoiding the urge to make quick decisions based on market emotions.
These principles can guide investors dealing with bearish signals, emphasizing the importance of preparation, patience, and focusing on long-term value rather than short-term market movements.
Conclusion
The bearish harami pattern represents a valuable tool in the technical analyst’s arsenal, providing early warning signals for potential trend reversals and helping traders make more informed decisions in dynamic market conditions. Throughout this comprehensive exploration, we’ve examined every aspect of this important candlestick formation, from its basic structure to advanced trading applications.
Understanding the bearish harami requires more than simple pattern recognition. Successful implementation demands appreciation for market psychology, proper risk management, and the ability to combine pattern analysis with other technical and fundamental factors. The pattern’s moderate reliability of 55-65% in isolation improves significantly when traders employ confirmation techniques and consider broader market context.
The key takeaways for traders include the importance of waiting for confirmation before acting on bearish harami signals, understanding the pattern’s limitations and false signal potential, and recognizing that no single pattern should form the basis of a complete trading strategy. Volume analysis, trend context, and post-pattern price action all play crucial roles in determining the pattern’s ultimate effectiveness.
Whether you’re a short-term trader looking for reversal opportunities or a long-term investor seeking to time market entries and exits more effectively, the bearish harami pattern offers valuable insights into market sentiment shifts. However, like all technical analysis tools, it works best when combined with sound money management principles, thorough market analysis, and a clear understanding of your own risk tolerance and investment objectives.
As markets continue to evolve and new participants enter the trading landscape, classical patterns like the bearish harami remain relevant because they reflect fundamental aspects of human psychology and market behavior that persist across time and market conditions. By mastering this pattern and understanding its place within the broader context of technical analysis, traders can enhance their ability to navigate uncertain market conditions and identify profitable trading opportunities.
The journey to becoming a successful trader involves continuous learning and adaptation, and understanding candlestick patterns like the bearish harami represents an important step in that ongoing educational process. With proper application and realistic expectations, this pattern can contribute to more effective trading strategies and improved market timing for traders at all experience levels.


