
The Dragonfly Doji: A Complete Guide to Trading with This Powerful Candlestick Pattern
Introduction
In the world of technical analysis, candlestick patterns serve as valuable tools for traders seeking to interpret market sentiment and price action. Among these patterns, the Dragonfly Doji stands out as a particularly significant formation that often signals potential market reversals. This distinctive candlestick pattern, with its unique shape resembling a dragonfly or a “T”, provides insights into the battle between buyers and sellers at crucial price levels.

Understanding the Dragonfly Doji—when it appears, what it signifies, and how to effectively incorporate it into your trading strategy—can significantly enhance your technical analysis toolkit and potentially improve your trading outcomes.
What is a Dragonfly Doji?
A Dragonfly Doji is a specific type of candlestick pattern characterized by its distinctive “T” shape. It forms when the opening, high, and closing prices of an asset are approximately equal (or very close), while the low price extends significantly below them. This creates a candle with virtually no upper shadow (or a very minimal one), no real body (or an extremely small one), and a long lower shadow.
The name “Dragonfly” is derived from its appearance, as the long lower shadow resembles the body of a dragonfly, while the minimal or non-existent upper body represents its wings. In Japanese candlestick terminology, “Doji” signifies indecision in the market, where neither buyers nor sellers have gained clear control. However, the specific shape of the Dragonfly Doji tells a more nuanced story about the trading session it represents.
Structure of a Dragonfly Doji Candlestick
The Dragonfly Doji has three key structural components:
- Little or No Upper Shadow: The high price is at or very near the opening and closing prices, indicating minimal upward price movement during the session.
- Little or No Real Body: The opening and closing prices are at or very near the same level, creating either a flat line or an extremely small body. This indicates that despite trading activity, the price ended the session at essentially the same level it began.
- Long Lower Shadow: The price dropped significantly from the opening level during the session, creating a long lower shadow or “tail.” This represents selling pressure that was eventually overcome by buyers who pushed the price back up to the opening level.
The ideal Dragonfly Doji has no upper shadow and no real body at all, though in real trading scenarios, small variations are common and still considered valid patterns.
Red vs Green Dragonfly Doji: What Do They Indicate?
A Dragonfly Doji can appear either as red (bearish) or green (bullish), depending on whether the closing price is slightly below or above the opening price:
- Green Dragonfly Doji: Occurs when the closing price is marginally higher than the opening price. This might suggest a slightly stronger bullish sentiment at the close of the session.
- Red Dragonfly Doji: Occurs when the closing price is marginally lower than the opening price. This could indicate a slightly stronger bearish sentiment at session close.
Does the Color of a Dragonfly Doji Matter?
While the color distinction exists, the difference between red and green Dragonfly Dojis is often minimal in terms of the signal’s strength. The most significant aspect of the Dragonfly Doji is its overall shape rather than its color. The long lower shadow and the return to the opening price level are what truly matter in the interpretation of this pattern.
That said, some traders do assign slightly more bullish significance to a green Dragonfly Doji, particularly when it appears after a downtrend, as it may suggest that buying pressure managed to not only counter the selling pressure but also push the price slightly higher by session close.
When Does a Dragonfly Doji Occur?
A Dragonfly Doji typically occurs under the following market conditions:
- After a Downtrend: When found at the bottom of a downtrend, it often signals a potential reversal to the upside. This is its most powerful context.
- In a Trading Range: When occurring within a consolidation phase, it may indicate the continuation of the range-bound trading.
- After an Uptrend: Although less common and typically less reliable, a Dragonfly Doji may appear after an uptrend, potentially signaling exhaustion or a temporary pause in the bullish momentum.
The pattern represents a trading session where sellers initially dominated, pushing prices significantly lower, but buyers emerged to push the price back up to the opening level by the close. This rejection of lower prices can indicate strong buying interest emerging at the lower price levels.
How Often Does a Dragonfly Doji Appear?
Dragonfly Dojis are relatively uncommon patterns in most markets. Their frequency depends on various factors including:
- Market Volatility: They tend to appear more frequently in highly volatile markets where significant price swings occur within single sessions.
- Time Frame: They are more common on shorter time frames (such as hourly charts) compared to daily or weekly charts.
- Asset Class: Some assets naturally exhibit more Dragonfly Doji patterns than others, depending on their volatility characteristics and trading dynamics.
On average, a pure Dragonfly Doji might appear in less than 2% of all candlesticks across mainstream financial markets. However, if you include slight variations of the pattern (where the body is small rather than non-existent), the frequency increases to roughly 3-5% of candlesticks.
Reading Dragonfly Doji in Technical Analysis
When interpreting a Dragonfly Doji within technical analysis, consider these key aspects:

- Market Context: The pattern’s significance is greatly enhanced by its location within the broader market structure. A Dragonfly Doji at a support level after a downtrend carries much more weight than one appearing randomly within a sideways market.
- Volume Confirmation: Higher-than-average trading volume accompanying a Dragonfly Doji strengthens its signal, indicating strong participation during the price rejection.
- Previous Price Action: The significance of the pattern increases when it appears after an extended trend movement, potentially indicating exhaustion of the prior trend.
- Support/Resistance Levels: A Dragonfly Doji occurring at established support levels provides a stronger signal than one appearing in areas without historical significance.
The pattern essentially tells a story of a failed attempt by sellers to maintain control, with buyers stepping in to reverse the downward momentum—a potentially bullish development, especially after a downtrend.
Accuracy of Dragonfly Doji in Technical Analysis
Like all candlestick patterns, the Dragonfly Doji doesn’t offer absolute predictive accuracy. Research and backtesting have shown the following regarding its reliability:
- When appearing at the bottom of a downtrend and confirmed by subsequent price action, Dragonfly Dojis show a success rate of approximately 60-65% in predicting a reversal.
- Without confirmation from subsequent candles or supporting technical indicators, the success rate drops to roughly 45-50%.
- When appearing in contexts other than after a downtrend, the predictive accuracy decreases significantly, falling below 40% in many cases.
The pattern’s effectiveness increases substantially when combined with other forms of technical analysis rather than being used in isolation.
Effectiveness of the Dragonfly Doji Pattern
The effectiveness of the Dragonfly Doji as a trading signal depends on several factors:
- Confirmation: Waiting for confirmation through subsequent price action (such as a strong bullish candle following the Dragonfly Doji) significantly improves the pattern’s effectiveness.
- Supporting Indicators: Combining the Dragonfly Doji with momentum indicators (like RSI or MACD), support/resistance levels, or trendline analysis enhances its reliability.
- Market Conditions: The pattern tends to be more effective in trending markets than in choppy, range-bound conditions.
- Time Frame Alignment: The signal becomes stronger when identified across multiple time frames simultaneously.
Experienced traders typically don’t trade off a Dragonfly Doji alone but use it as one component of a comprehensive analysis framework.
Where is the Dragonfly Doji Commonly Used?
The Dragonfly Doji pattern is utilized across various financial markets:
- Stock Markets: Commonly used by equity traders for individual stocks and indices.
- Forex Markets: Popular among currency traders due to the forex market’s volatility which can produce clear Dragonfly Dojis.
- Cryptocurrency Markets: Their 24/7 trading and high volatility create frequent Dragonfly Doji opportunities.
- Commodities Markets: Used in trading gold, oil, and other commodities that often experience significant intraday price swings.
- Futures Markets: Employed by futures traders across various contract types.
The pattern is particularly valuable in markets with sufficient liquidity and volatility to generate the significant price movements necessary for its formation.
How to Trade Using the Dragonfly Doji Pattern
A systematic approach to trading the Dragonfly Doji pattern involves:
- Identify the Pattern: Look for the distinctive “T” shape with little to no upper shadow, minimal body, and a long lower shadow.
- Confirm the Context: The pattern is most reliable after a downtrend or at support levels.
- Wait for Confirmation: Look for a strong follow-through candle in the direction of the potential reversal (typically bullish after a Dragonfly Doji at the bottom of a downtrend).
- Check Volume: Higher-than-average volume adds credibility to the signal.
- Consider Other Technical Factors: Align with support/resistance levels, trendlines, and technical indicators.
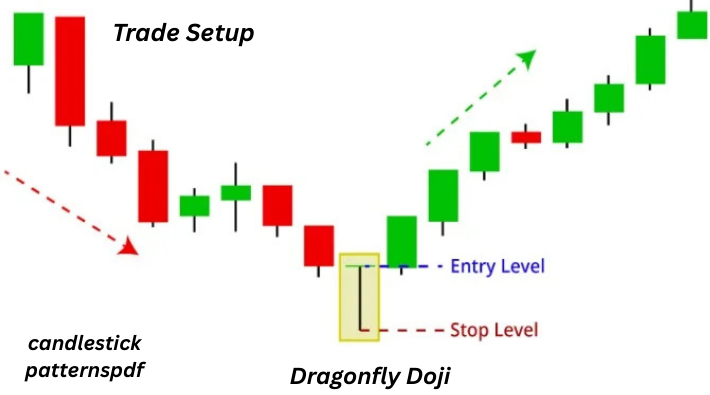
- Set Entry Points: Enter on confirmation rather than on the Dragonfly Doji itself.
- Establish Stop-Loss: Place a stop-loss order below the low of the Dragonfly Doji’s lower shadow.
- Define Profit Targets: Set realistic profit objectives based on previous resistance levels or using risk-reward ratios.
This methodical approach helps mitigate false signals and improves the overall effectiveness of trading with this pattern.
Best Time to Trade with a Dragonfly Doji
Optimal conditions for trading the Dragonfly Doji include:
- After a Clear Downtrend: The pattern is most powerful when it appears after a well-defined downtrend, potentially signaling a reversal.
- At Key Support Levels: Trading the pattern is more effective when it appears at historically significant support levels.
- During Normal Market Hours: Trading during peak market hours ensures sufficient liquidity for proper pattern formation and follow-through.
- When Confirmed by Volume: The best setups occur when the Dragonfly Doji is accompanied by higher-than-average trading volume.
- In Conjunction with Broader Market Sentiment: The pattern works better when aligned with the broader market direction or at potential turning points in major indices.
- When Visible on Multiple Time Frames: The signal strengthens if the pattern or its implications are visible across different time frames.
Patience in waiting for these optimal conditions can significantly improve trading outcomes.
Examples of Dragonfly Doji in Trading
Let’s examine some real-world examples of Dragonfly Doji patterns and their outcomes:
Example 1: Reversal Signal In a declining stock market, Company XYZ’s stock fell for seven consecutive sessions. On the eighth day, it formed a Dragonfly Doji at a historical support level with 30% above-average volume. The following day produced a strong bullish candle, confirming the reversal signal. The stock subsequently rallied 15% over the next three weeks.
Example 2: Failed Signal In a sideways crypto market, Bitcoin formed what appeared to be a Dragonfly Doji. However, volume was below average, and no significant support level coincided with the pattern. The following day’s price action failed to confirm the potential bullish signal, and prices continued to drift lower.
Example 3: Continuation Pause During a strong uptrend in gold prices, a Dragonfly Doji appeared after seven bullish days. Rather than signaling a reversal, this represented a brief pause in buying pressure. The uptrend resumed after a single day of consolidation.
These examples highlight the importance of context, confirmation, and supporting factors when trading the Dragonfly Doji pattern.
Is a Dragonfly Doji Bullish or Bearish?
The Dragonfly Doji is generally considered a bullish reversal signal, especially when it appears after a downtrend. Its formation suggests that sellers initially controlled the session, pushing prices significantly lower, but buyers eventually emerged with enough strength to push the price back to the opening level.
The bullish interpretation is based on the price rejection from lower levels, indicating strong buying interest emerged during the session. However, its bullishness is contextual:
- After a Downtrend: Strongly bullish reversal signal
- During a Range: Potentially bullish, but less reliable
- After an Uptrend: Could indicate exhaustion or a pause; less reliable as a bullish signal
As with all technical patterns, context matters significantly in determining whether the Dragonfly Doji should be interpreted as bullish, neutral, or occasionally even bearish.
Drawbacks of the Dragonfly Doji Pattern
Despite its usefulness, the Dragonfly Doji pattern has several limitations:
- False Signals: Like all candlestick patterns, it can produce false signals, especially in volatile or choppy markets.
- Subjectivity: There’s no universal agreement on exactly how small the body must be or how long the lower shadow should be to qualify as a “true” Dragonfly Doji.
- Lagging Indicator: Being based on already completed price action, it is inherently retrospective rather than predictive.
- Variable Reliability: Its effectiveness varies significantly depending on market conditions, timeframes, and asset classes.
- Confirmation Requirement: The need for confirmation means potentially missing part of the price movement following the pattern.
- Context Dependency: In isolation, without considering market context, the pattern loses much of its predictive value.
Understanding these limitations helps traders set realistic expectations and implement appropriate risk management strategies when trading the pattern.
Other Types of Doji Candlestick Patterns
The Dragonfly Doji is one of several Doji variations, each with distinct characteristics and interpretations:
- Standard Doji: Has small or no real body with short upper and lower shadows of approximately equal length. Indicates market indecision.
- Gravestone Doji: The opposite of the Dragonfly, with no lower shadow and a long upper shadow. Typically bearish, especially after an uptrend.
- Long-Legged Doji: Features significantly long upper and lower shadows, indicating extreme volatility and indecision during the session.
- Four Price Doji: Extremely rare, occurs when the open, high, low, and close are all at the same price level. Indicates complete market equilibrium or extremely low volatility.
Each Doji type provides different insights into market psychology and potential future price movements based on their unique structures.
Similar Candlestick Patterns to Dragonfly Doji
Several candlestick patterns share similarities with the Dragonfly Doji:
- Hammer: Very similar to the Dragonfly Doji but has a small real body. Like the Dragonfly Doji, it’s bullish when appearing after a downtrend.
- Bullish Pin Bar: A term often used in Western technical analysis that encompasses both Dragonfly Dojis and hammers, focusing on the price rejection from lower levels.
- Paper Umbrella: A category of candlesticks that includes both hammers and Dragonfly Dojis, characterized by long lower shadows and little to no upper shadows.
- Hanging Man: Visually identical to the hammer but appears after an uptrend and is considered a bearish signal.
Understanding these related patterns helps traders better classify and interpret the candlestick formations they encounter in real trading scenarios.
Opposite of the Dragonfly Doji Pattern
The direct opposite of the Dragonfly Doji is the Gravestone Doji. While both are Doji patterns (with opening and closing prices at or near the same level), they have inverse structures and implications:

- Gravestone Doji: Features a long upper shadow with little or no lower shadow, forming an upside-down “T” shape. It indicates that buyers pushed prices higher during the session but failed to maintain control, allowing sellers to push the price back down to the opening level by close.
- While the Dragonfly Doji is typically bullish (especially after a downtrend), the Gravestone Doji is generally bearish (particularly after an uptrend).
- Both patterns represent failed attempts to move prices in a certain direction, with control ultimately returning to the opposing market force by session close.
Understanding both patterns provides a more complete perspective on price rejection dynamics in the market.
Conclusion
The Dragonfly Doji stands as one of technical analysis’s most visually distinctive and potentially powerful candlestick patterns. Its unique structure tells the story of a trading session where sellers initially dominated but buyers ultimately prevailed, returning prices to their opening levels. This rejection of lower prices can signal a potential reversal, particularly when the pattern appears after a downtrend or at significant support levels.
However, like all technical patterns, the Dragonfly Doji is not infallible. Its effectiveness is significantly enhanced when:
- It appears in the right market context
- It’s confirmed by subsequent price action
- It’s supported by other technical indicators or analysis methods
- It’s accompanied by appropriate volume
Successful traders don’t rely on the Dragonfly Doji in isolation but incorporate it as one component in a comprehensive trading strategy. By understanding both its strengths and limitations, you can more effectively harness the insights this distinctive pattern provides.
Remember that patience and discipline remain essential when trading any pattern. Waiting for optimal conditions and confirmation before entering positions based on a Dragonfly Doji significantly improves the probability of successful outcomes. With practice and experience, this distinctive candlestick formation can become a valuable addition to your technical analysis toolkit.


