
The Inverted Hammer Candlestick: A Complete Guide for Traders
Introduction
The world of technical analysis offers traders numerous tools to identify potential market reversals and entry points. Among these tools, candlestick patterns stand out for their visual clarity and historical reliability. The inverted hammer is one such pattern that frequently appears on price charts across various financial markets. When properly identified and interpreted, this pattern can provide valuable insights about possible trend reversals, particularly after a downtrend.
This comprehensive guide examines the inverted hammer candlestick pattern in detail—from its distinctive appearance to practical trading strategies and methods to improve your analysis. Whether you’re a beginner just learning about technical analysis or an experienced trader looking to refine your candlestick pattern recognition skills, understanding the inverted hammer can add a powerful tool to your trading arsenal.
What Is the Inverted Hammer Candlestick?
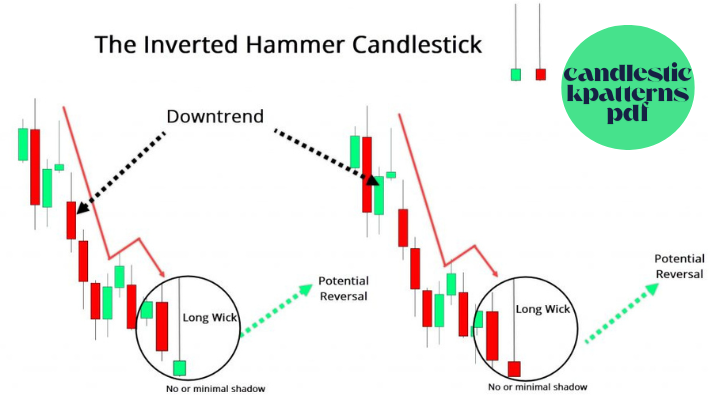
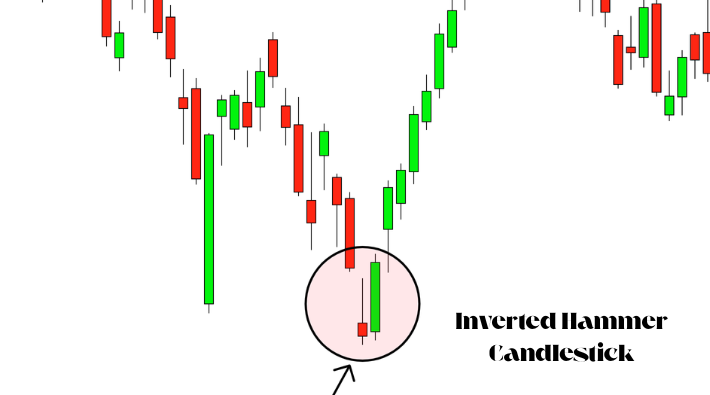
The inverted hammer is a single-candle bullish reversal pattern that typically forms at the bottom of a downtrend. As its name suggests, it resembles an upside-down hammer, with a small body and a long upper shadow (or wick). This pattern signals that buyers attempted to push prices higher during the trading session but met resistance, yet sellers couldn’t drive prices lower by the close—suggesting a potential weakening in the downtrend momentum.
The inverted hammer is particularly significant because it can indicate exhaustion among sellers and the potential for buyers to take control. When this pattern appears after a prolonged downtrend, it often serves as an early warning sign that the bearish momentum may be diminishing and a trend reversal could be imminent.
What Does the Inverted Hammer Look Like?
The inverted hammer has several distinctive visual characteristics:
- Small body: The real body (the area between the opening and closing prices) is relatively small compared to the overall candle size.
- Long upper shadow: The upper shadow (or wick) extends significantly above the body, ideally at least twice the length of the body itself.
- Little to no lower shadow: The inverted hammer has minimal or no lower shadow beneath its body.
- Body color: The body can be either bullish (green/white) or bearish (red/black), though a bullish body adds slightly more weight to the reversal signal.
For proper identification, the inverted hammer should appear after a clear downtrend. When found in isolation or during an uptrend, this same candlestick shape is called a “shooting star” and takes on a bearish rather than bullish implication.
What Does the Inverted Hammer Candlestick Mean?
The formation of an inverted hammer tells a specific story about the trading session:
- The session opens and prices initially move in the direction of the prevailing downtrend (lower).
- Then, buyers step in and push prices significantly higher, creating the long upper shadow.
- However, sellers regain some control and push prices back down toward the opening level.
- Despite sellers’ efforts, the price closes near the opening price, forming the small body.
This price action suggests that while sellers still have some control (as evidenced by their ability to push prices back down from the session high), their dominance may be waning. The significant buying pressure that created the long upper shadow indicates that bulls are beginning to test the waters and may soon gain enough momentum to reverse the downtrend.
Psychologically, the inverted hammer represents a potential shift in market sentiment from bearish to bullish. After a prolonged downtrend, this pattern suggests seller exhaustion and renewed buyer interest—key ingredients for a potential trend reversal.
How Do You Trade on an Inverted Hammer Candlestick?
Successfully trading the inverted hammer pattern requires a strategic approach. Here’s a step-by-step guide:
1. Confirm the Pattern
Wait for confirmation before entering a trade based solely on an inverted hammer. The most common confirmation is a bullish candle following the inverted hammer, preferably with higher trading volume. This subsequent price action helps validate that buyers are indeed taking control of the market.
2. Entry Strategy
Conservative Approach: Enter a long position after the confirmation candle closes above the high of the inverted hammer.
Aggressive Approach: Enter a long position at the market open following the inverted hammer formation, anticipating confirmation.
3. Stop-Loss Placement
Place your stop-loss below the low of the inverted hammer candle. This logical placement protects your position if the potential reversal fails to materialize.
4. Take-Profit Targets
Consider multiple take-profit levels:
- First target: Previous resistance level or 1:1 risk-reward ratio
- Second target: 2:1 risk-reward ratio
- Final target: Next major resistance level or 3:1 risk-reward ratio
5. Position Sizing
Use appropriate position sizing based on your risk tolerance, account size, and the distance to your stop-loss. A common approach is risking no more than 1-2% of your trading capital on a single trade.
Real-World Example
Let’s say you’re analyzing a stock that has been in a downtrend for several weeks:
- You spot an inverted hammer forming at a support level.
- The next day, the stock opens higher and continues to rise, confirming the pattern.
- You enter a long position slightly above the opening price.
- Your stop-loss is placed just below the low of the inverted hammer candle.
- You set take-profit orders at key technical levels above, planning to take partial profits at each level.
- As the reversal develops, you might also trail your stop-loss to lock in profits.
How to Improve the Accuracy of the Inverted Hammer
While the inverted hammer is a valuable signal on its own, combining it with other technical indicators and considerations can significantly improve its reliability:
Support Levels
An inverted hammer that forms at a key support level carries more weight. These levels might include:
- Previous swing lows
- Round psychological numbers
- Fibonacci retracement levels
- Long-term moving averages
- Trend lines
When the pattern appears at these technical junctures, the probability of a successful reversal increases substantially.
Volume Confirmation
High trading volume during the formation of an inverted hammer strengthens its signal. Increased volume suggests more significant buying pressure and greater participation in the potential reversal. Ideally, volume should be above average during the formation of the inverted hammer and even higher during the confirmation candle.
Trend Analysis
Consider the overall market context and trend duration:
- An inverted hammer after a steep, extended downtrend is often more reliable than one forming after a mild correction.
- The pattern works best when the market is overextended to the downside, as indicated by technical oscillators.
Technical Indicators
Pair the inverted hammer with other technical indicators for additional confirmation:
- RSI (Relative Strength Index): Look for bullish divergence or oversold readings below 30.
- MACD (Moving Average Convergence Divergence): Watch for a crossover or a divergence coinciding with the pattern.
- Stochastic Oscillator: Identify oversold conditions or bullish crossovers.
- Bollinger Bands: An inverted hammer touching or breaking the lower band signals potential overselling.
Multiple Timeframe Analysis
Confirm the pattern across different timeframes:
- Identify the inverted hammer on your primary trading timeframe (e.g., daily chart).
- Check higher timeframes for overall trend direction and key levels.
- Monitor lower timeframes for optimal entry timing after confirmation.
This multi-timeframe approach helps ensure that your trade aligns with the broader market structure while providing more precise entry opportunities.
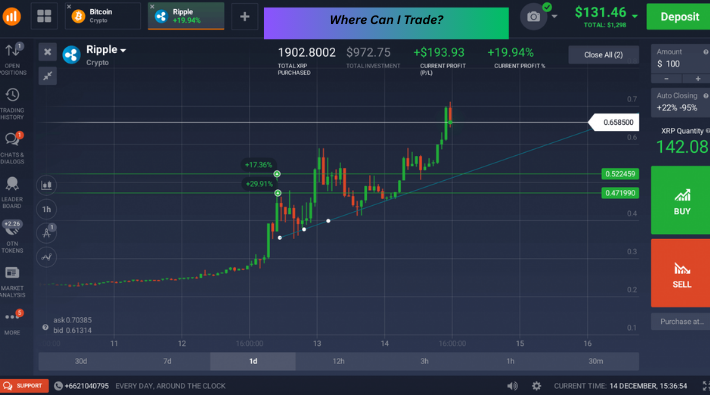
Where Can I Trade?
Inverted hammer patterns can be traded across various financial markets and platforms:
Traditional Stock Markets
Major stock exchanges offer numerous opportunities to identify and trade inverted hammer patterns. Consider using established brokers like:
- TD Ameritrade
- Charles Schwab
- Fidelity
- Interactive Brokers
- E*TRADE
These platforms provide advanced charting tools necessary for identifying candlestick patterns effectively.
Forex Markets
The 24-hour forex market, with its high liquidity and volatility, frequently displays inverted hammer patterns. Popular forex brokers include:
- OANDA
- IG
- Pepperstone
- FXCM
- XM
Cryptocurrency Exchanges
Crypto markets, known for their volatility, regularly form clear candlestick patterns including inverted hammers. Leading exchanges include:
- Binance
- Coinbase Pro
- Kraken
- KuCoin
- FTX
Futures and Commodities
Traders can also spot inverted hammer patterns in futures markets, including:
- CME Group (for commodities, indices, and currencies)
- ICE (for energy and agricultural products)
Important Considerations When Choosing a Platform
When selecting a trading platform, consider these factors:
- Charting capabilities: Advanced candlestick charts with multiple timeframes
- Technical indicators: Access to RSI, MACD, and other complementary tools
- Execution speed: Fast and reliable order execution
- Costs: Competitive spreads or commissions
- Educational resources: Materials to improve your technical analysis skills
Conclusion
The inverted hammer candlestick represents a powerful visual signal that can help traders identify potential market reversals. By understanding its formation, psychological implications, and proper trading strategies, you can effectively incorporate this pattern into your technical analysis toolkit.
Remember that no candlestick pattern works in isolation. The inverted hammer’s reliability dramatically improves when combined with supporting evidence from trend analysis, volume confirmation, key support levels, and complementary technical indicators. By taking a holistic approach and practicing proper risk management, you can use the inverted hammer pattern to identify promising trading opportunities while protecting your capital.
For traders at any experience level, mastering the inverted hammer pattern provides valuable insight into market psychology and potential turning points. As with any technical analysis tool, consistent practice and continuous evaluation of your results will help refine your ability to trade this pattern successfully across different market conditions.


