Three Black Crows Candlestick: Definition, Structure, Trading, Benefits, and Limitations
What is a Three Black Crows Candlestick?
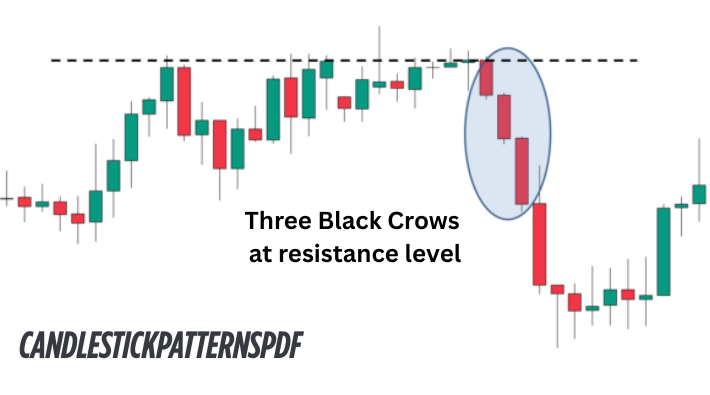
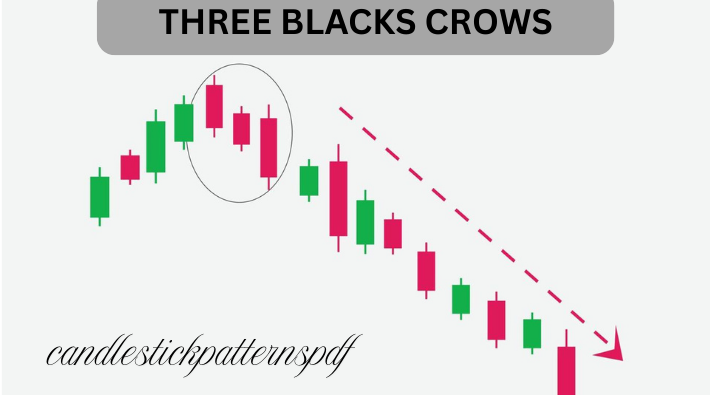
The Three Black Crows is a bearish candlestick pattern that consists of three consecutive long-bodied red (or black) candles that close near their lows. This pattern typically emerges after an uptrend and signals a strong shift in market sentiment from bullish to bearish. Traders often interpret this pattern as a warning sign of a potential reversal in price direction, indicating that selling pressure has overwhelmed buying interest.
Each consecutive candle opens within or near the real body of the previous candle and closes at a lower level, creating a stair-step pattern downward. The consistent formation of these bearish candles demonstrates that sellers are firmly in control of the market across multiple trading sessions.
Is a Three Black Crows a Triple Candlestick Pattern?
Yes, the Three Black Crows is indeed a triple candlestick pattern, as it consists of exactly three consecutive bearish candlesticks. This pattern belongs to the category of multiple candlestick patterns, which require a specific sequence of candles to form a recognizable configuration. Unlike single candlestick patterns (such as Doji or Hammer), triple patterns like the Three Black Crows provide stronger confirmation of potential market reversals by showing sustained momentum over multiple trading periods.
What is the Significance of Three Black Crows Candlestick Patterns?
The Three Black Crows pattern holds significant importance in technical analysis due to its strong bearish implications. Its primary significance includes:
- Trend Reversal Signal: When appearing after an uptrend, it suggests that bulls have lost control and a downtrend may be beginning.
- Confirmation of Bearish Sentiment: The consecutive bearish candles confirm that selling pressure is not just a temporary pullback but potentially a sustained change in market direction.
- Psychological Significance: It represents a shift in market psychology where optimism has been replaced by pessimism.
- Volume Validation: When accompanied by increasing volume, the pattern’s reliability increases substantially, as it shows growing participation in the selling pressure.
- Support Level Breakdown: The pattern often indicates that key support levels may be broken, opening the path for further price declines.
How Are the Three Black Crows Candlestick Pattern Structured?
The Three Black Crows pattern follows a specific structure:
- First Crow: Appears at or near the peak of an uptrend, with a bearish (black/red) candle that has a relatively large real body and small shadows.
- Second Crow: Opens within or slightly below the real body of the first candle and closes even lower, creating another bearish candle with similar characteristics.
- Third Crow: Continues the pattern by opening within or slightly below the real body of the second candle and closing lower still.
Key structural characteristics include:
- Each candle should have a relatively long real body
- The closing price of each candle should be near its low
- Little to no lower shadows (ideally)
- Small or moderate upper shadows
- Consecutive lower closes with each subsequent candle
When Do Three Black Crows Candlestick Patterns Occur?
Three Black Crows typically occur under the following market conditions:
- After a Prolonged Uptrend: The pattern is most significant when it appears after a sustained bullish market, signaling exhaustion among buyers.
- Near Resistance Levels: When prices approach significant resistance zones, the pattern may form as buyers fail to break through these levels.
- During Overbought Conditions: Often occurs when technical indicators suggest the market is overbought, adding to the validity of the reversal signal.
- Following Positive News Absorption: Sometimes appears after the market has already priced in positive news, suggesting that bullish sentiment has peaked.
- At Market Cycle Tops: May emerge at the end of broader market cycles, potentially indicating a larger shift in market direction.
What are the Criteria for Recognizing the Three Black Crows Candlestick Pattern in Technical Analysis?
To properly identify this pattern, traders should look for these specific criteria:
- Prior Uptrend: The pattern should form after a clear uptrend, as its significance as a reversal signal diminishes in sideways or already bearish markets.
- Three Consecutive Bearish Candles: Each must close lower than the previous one, with little to no overlap between closing and opening prices.
- Opening Within Previous Real Body: Ideally, each candle should open within or very close to the real body of the previous candle.
- Closing Near Period Lows: Each candle should close at or near its low, indicating strong selling pressure throughout the trading period.
- Size Consistency: The three candles should be of comparable size, with no substantial difference in their real body lengths.
- Minimal Lower Shadows: Small or no lower wicks suggest sellers maintained control throughout the trading session.
- Progressively Increasing Volume: While not mandatory, increasing volume through the pattern strengthens its reliability.
How Accurate are Three Black Crows Candlestick Patterns?
The accuracy of the Three Black Crows pattern varies depending on market conditions and additional confirmation factors. Research and backtesting suggest moderately high reliability when the pattern follows all the classic criteria:
- Historical Accuracy: Various studies place the accuracy between 60-78% when formed under ideal conditions.
- Market-Dependent: The pattern tends to be more reliable in stock markets than in more volatile markets like cryptocurrencies.
- Timeframe Influence: Generally more accurate on higher timeframes (daily, weekly) than on shorter intervals where noise can create false signals.
- Confirmation Dependency: Without additional confirmation from other technical indicators, the stand-alone accuracy decreases to approximately 50-60%.
Can You Improve the Accuracy of the Three Black Crows Candlestick?
Yes, the accuracy of the Three Black Crows pattern can be significantly improved by incorporating the following elements:
- Confirmation with Technical Indicators:
- Divergence with RSI (Relative Strength Index)
- MACD (Moving Average Convergence Divergence) crossover in the bearish direction
- Breakdown of key moving averages
- Volume expansion during pattern formation
- Support Level Analysis: Confirming that the pattern breaks below important support levels increases its reliability.
- Market Context Assessment: Evaluating broader market conditions, sector performance, and overall market sentiment.
- Timeframe Alignment: Ensuring the pattern appears on multiple timeframes simultaneously (time frame confluence).
- Proper Location: Focusing on patterns that form after extended uptrends or at significant resistance zones.
- Candle Characteristics: Prioritizing patterns with ideal candle formation—long bodies, minimal shadows, and consistent size.
What is the Success Rate of Three Black Crows Candlestick Patterns?
The success rate of the Three Black Crows pattern has been studied across various markets:
- When formed according to textbook criteria and confirmed with other indicators, success rates can reach 70-75% in trending markets.
- Success rates tend to decrease in choppy or ranging markets, falling to approximately 45-55%.
- Studies suggest that when the pattern forms with increasing volume on each successive candle, the success rate improves by approximately 10-15%.
- Market-specific research indicates that the pattern performs better in equity markets than in forex or cryptocurrency markets.
- Seasonal factors can also affect success rates, with some research suggesting higher reliability during periods of increased market volatility.
How to Trade Using Three Black Crows Candlestick in the Stock Market?
Effective trading strategies for the Three Black Crows pattern include:
- Entry Strategies:
- Enter a short position after the confirmation of the third black crow
- Wait for a small retracement following the pattern before entering
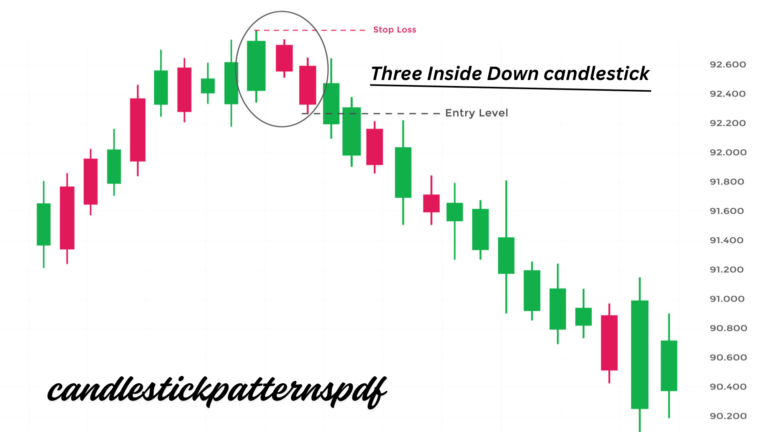
- Use the high of the pattern as a reference point for stop-loss placement
- Exit Strategies:
- Target previous support levels for taking profits
- Implement trailing stops to capture extended downward movements
- Consider Fibonacci retracement levels for systematic profit-taking
- Risk Management:
- Place stop-loss orders above the high of the first candle
- Limit position size to 1-2% of trading capital
- Consider scaling out of positions to lock in profits while allowing for further downside
- Confirmation Techniques:
- Wait for a close below a key support level
- Look for increasing volume throughout the pattern
- Confirm with momentum indicators showing bearish divergence
Examples of Three Black Crows Candlestick Pattern in Trading
Example 1: Stock Market Reversal
In September 2021, Apple (AAPL) stock formed a Three Black Crows pattern near its all-time high around $157. The pattern appeared after a strong uptrend and preceded a 10% correction over the following weeks. Volume increased through each candlestick, providing additional confirmation of the reversal signal.
Example 2: Index Reversal Signal
The S&P 500 showed a Three Black Crows pattern in February 2020, just before the major market correction related to COVID-19 concerns. This pattern emerged near the index’s peak and was followed by one of the fastest bear markets in history, demonstrating the pattern’s potential significance at market turning points.
Example 3: Failed Pattern
In March 2022, Netflix (NFLX) formed what initially appeared to be a Three Black Crows pattern. However, the third candle had a significant lower shadow, indicating buying interest near the lows. The pattern failed to produce a sustained downtrend, and prices stabilized before continuing their previous trend, illustrating the importance of strict pattern criteria.
Can You Trade Three Black Crows Candlestick Pattern with MACD?
Yes, combining the Three Black Crows pattern with the MACD (Moving Average Convergence Divergence) indicator can create a powerful trading strategy:
- MACD Bearish Crossover: Look for the MACD line crossing below the signal line during or shortly after the Three Black Crows formation, providing a strong confirmation signal.
- Negative Histogram Expansion: When the MACD histogram bars grow increasingly negative during the pattern formation, it confirms strengthening bearish momentum.
- Bearish Divergence: When price makes new highs but the MACD creates lower highs before the Three Black Crows appears, this divergence adds substantial credibility to the reversal signal.
- Signal Amplification: The combination can help filter out false signals—only take trades when both the candlestick pattern and MACD provide aligned bearish signals.
- Exit Strategy Enhancement: Use MACD for exit timing by waiting for signs of momentum exhaustion or potential reversal.
What are the Benefits of the Three Black Crows Candlestick Pattern?
The Three Black Crows pattern offers several advantages to traders:
- Clear Visual Signature: The pattern is visually distinctive and relatively easy to identify on charts.
- Strong Psychological Component: Represents a clear shift in market psychology from bullish to bearish sentiment.
- Versatility Across Markets: Can be applied to various financial instruments including stocks, indices, commodities, and forex.
- Multiple Timeframe Application: Effective across different timeframes, from daily charts for swing trading to hourly charts for day trading.
- Early Warning System: Often provides early indication of a potential trend reversal before other technical indicators.
- Integration Capability: Easily combines with other technical analysis tools to create comprehensive trading strategies.
- Momentum Insight: Reveals not just direction but the strength of selling pressure in the market.
What are the Limitations of the Three Black Crows Candlestick Pattern?
Despite its benefits, traders should be aware of these limitations:
- False Signals: In volatile or ranging markets, the pattern may generate false signals leading to premature entries.
- Subjectivity Issues: There can be disagreement among traders about what constitutes “real” Three Black Crows, particularly regarding candle size and shadow length.
- Lagging Indicator Nature: By the time the pattern completes, a significant portion of the move may have already occurred.
- Market Condition Dependency: Performance varies greatly depending on broader market conditions and can be less reliable during unusual market environments.
- Confirmation Requirement: Needs additional confirmation from other technical tools, limiting its standalone value.
- Oversold Rebounds: The pattern can form during deeply oversold conditions, leading to immediate counter-trend bounces rather than continued downward movement.
- Variable Effectiveness: Success rates can differ significantly across various market sectors and instruments.
Are Three Black Crows Bullish?
No, the Three Black Crows pattern is definitively bearish, not bullish. It signals a potential downward reversal or continuation of a bearish trend. The pattern represents strong selling pressure overwhelming buying interest over three consecutive periods.
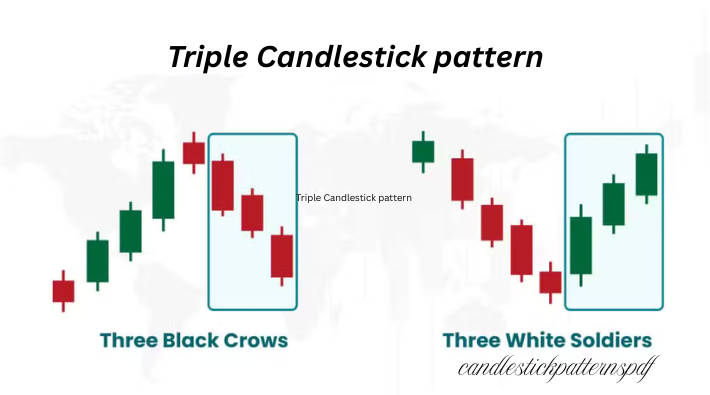
The bullish counterpart to this pattern is called “Three White Soldiers,” which consists of three consecutive bullish (white/green) candles that close near their highs, indicating potential upward movement.
Traders should be careful not to confuse these opposite patterns, as they signal contrary market directions and would lead to opposite trading decisions.
Conclusion
The Three Black Crows candlestick pattern remains one of the most respected bearish reversal signals in technical analysis. When properly identified and confirmed with supporting indicators, it provides valuable insight into potential market turning points and can form the foundation of effective trading strategies.
To maximize success with this pattern, traders should:
- Ensure all pattern criteria are strictly met
- Seek confirmation from multiple sources
- Consider the broader market context
- Implement proper risk management techniques
- Avoid overreliance on any single pattern
While not infallible, the Three Black Crows pattern has stood the test of time as a useful tool in a technical analyst’s arsenal. Its visual distinctiveness, psychological underpinnings, and historical performance make it worthy of consideration in any comprehensive trading approach. By understanding both its strengths and limitations, traders can appropriately incorporate this pattern into their market analysis and decision-making processes.